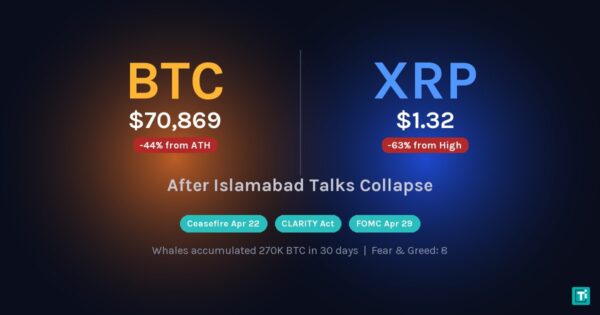

Bitcoin is trading at $72,095 as of April 9, 2026, down ~43% from its $126,200 all-time high set in October 2025 but rallying after the April 8 Iran ceasefire triggered a risk-on rotation across global markets. The Fear & Greed Index has improved from Extreme Fear to Fear as Brent crude crashed from $110 to $96 within hours of the ceasefire announcement, unwinding weeks of geopolitical risk premium. U.S. spot ETFs now hold ~1.29 million BTC, whale addresses are at record levels despite the drawdown, and net inflows resumed in late February. The central question for every Bitcoin investor in 2026: with the ceasefire removing the biggest macro headwind, can BTC reclaim $80,000 and resume the institutional-driven bull thesis, or is the 4-year halving cycle crash still playing out?
Key Takeaways
- BTC Price: $72,095 as of April 9, 2026 — down ~43% from $126,200 ATH. Rallied from $69K after the April 8 ceasefire, now testing the $72K resistance zone.
- Market Sentiment: Fear (improving from Extreme Fear) — ceasefire crashed oil to $96, easing the macro headwind that compressed all risk assets.
- Institutional Floor: 12 U.S. spot ETFs hold ~1.29M BTC (~$93B). Whale addresses at record levels despite the drawdown.
- Halving Debate: Traditional 4-year cycle predicts a crash; institutional flow cycle may have permanently altered the pattern. Ceasefire strengthens the bull counter-argument.
- Forecasts: Standard Chartered $150K-$200K (bull), base case $80K-$100K by year-end (strengthened by ceasefire). Bear case $40K-$45K now requires ceasefire collapse or Fed hike.
Table of Contents
Bitcoin Price Today. Live Data
Bitcoin spent roughly 50 days compressed between $60,000 and $72,000 before the April 8 ceasefire provided the catalyst to test the upper boundary. At $72,095, BTC is pressing against the resistance zone that has capped rallies since mid-February. A decisive break above $72,000 on sustained volume would open the path toward $80,000, where the 200-day moving average sits. Key support remains at $60,000, while the 24-hour trading volume has picked up from the subdued $11 billion range toward $14 billion as momentum traders re-engage.
Why Bitcoin Is Falling in 2026
Bitcoin’s 43% decline from its October 2025 peak did not happen overnight. It was driven by a convergence of macro shocks that collectively crushed risk appetite across every asset class, and crypto, as the most volatile major asset, took the hardest hit.
The Iran Crisis and Oil Shock
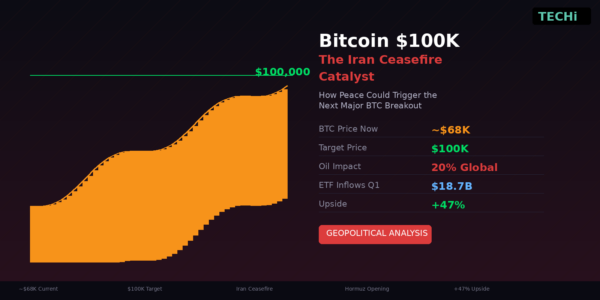
The single biggest driver of Bitcoin’s decline was the Iran-Israel conflict and its cascading effects on global energy markets. Iran’s effective blockade of the Strait of Hormuz, through which 21% of the world’s oil transits daily, pushed Brent crude above $112 per barrel at the peak of the crisis. The resulting oil shock triggered a classic risk-off rotation: investors dumped equities, crypto, and growth assets in favor of gold (which hit record highs above $4,500) and energy stocks. The April 8 ceasefire dramatically reversed this dynamic. Brent crashed to $96 within hours, and risk assets including Bitcoin caught an immediate bid. BTC rallied from $69,000 to $72,000 as the geopolitical risk premium that had weighed on crypto for weeks began to unwind.
The Fed’s Hawkish Pivot
Coming into 2026, markets expected the Federal Reserve to continue cutting rates toward 3%. Instead, the oil-driven inflation spike forced the Fed to hold at 3.5%–3.75%, and fed funds futures had priced a 52% probability of rate hikes heading into the April 28–29 FOMC meeting. The ceasefire complicates that picture: if oil stays near $96 rather than $110+, the inflation impulse fades and the case for hikes weakens considerably. Higher-for-longer rates strengthen the dollar, raise the opportunity cost of holding zero-yield assets like Bitcoin, and tighten financial conditions — but the macro backdrop just shifted meaningfully in crypto’s favor.
Miners Pivoting to AI and Dumping BTC
The April 2024 halving cut the block reward from 6.25 BTC to 3.125 BTC, slashing miner revenue in half. With Bitcoin now at $72,095, modestly above many miners’ break-even costs, publicly traded miners like Marathon Digital and Riot Platforms have been selling reserves to fund pivots into AI data center infrastructure. This structural selling pressure from miners, who collectively produce approximately 450 BTC per day (~$30 million), has added consistent downward pressure that did not exist during previous cycles.
Options Expiry and Technical Selling
A $14 billion options expiry in late March intensified selling pressure as market makers hedged their positions. The max-pain price for the expiry sat well below $70,000, creating gravitational pull downward. Combined with liquidations of over-leveraged long positions, more than $200 million in long liquidations occurred in a single 24-hour period, the technical selling compounded the fundamental pressures.
The Halving Cycle Debate. Is the 4-Year Pattern Dead?
This is the most consequential question in crypto markets right now, and the answer will determine whether Bitcoin is headed to $40,000 or $200,000 over the next 12 months.
The Traditional View: 2026 Is the Crash Year
According to the traditional 4-year halving cycle, Bitcoin follows a predictable pattern: the halving year is bullish, the year after (Year 2) sees a blow-off top, and Year 3 brings the bear market crash. Under this framework, the April 2024 halving would place 2026 squarely in the crash phase, and historically, these drawdowns have been brutal. After the 2017 peak, Bitcoin fell 84%. After the 2021 peak, it fell 78%. A 78% decline from the $126,200 ATH would imply a bottom around $27,800.
Investment firm CoinDesk Research published a March 2026 analysis warning that Bitcoin could decline another 30% from current levels if the cycle pattern holds, targeting a range of $40,000–$45,000 as the cycle bottom.
The Counter-Argument: Institutional Flows Broke the Cycle
On the other side, a growing number of institutional analysts argue that the 4-year cycle is an artifact of a retail-dominated market that no longer exists. Amberdata’s 2026 outlook put it bluntly: the halving cycle as we knew it is functionally over, replaced by an institutional flow cycle driven by ETF demand, corporate treasury allocation, and sovereign wealth fund positioning.
The data backs this up. The April 2024 halving reduced new Bitcoin supply to approximately 450 BTC per day (roughly $30 million at current prices). Meanwhile, U.S. spot Bitcoin ETFs have regularly absorbed $300–500 million in daily inflows during accumulation phases, more than 10 times the daily new supply. When institutional demand outstrips new supply by that magnitude, the supply shock dynamics of halvings become secondary to flow dynamics.
Raoul Pal, the macro investor and former Goldman Sachs executive, has proposed a variation on this theory: the cycle has not disappeared, but it has extended. He argues that Bitcoin now follows a 5-year cycle tied to corporate debt maturity and refinancing windows rather than the 4-year halving schedule. Under this framework, the current drawdown is a mid-cycle correction within a longer bull market, and the secular peak would not arrive until late 2027 or 2028.
Institutional Accumulation. Who’s Buying the Dip?
While retail sentiment plunged to Extreme Fear levels during the worst of the crisis (and has only recently improved to Fear after the ceasefire), the on-chain data tells a different story. Whale addresses (wallets holding more than 1,000 BTC) are at record numbers despite the price decline. This divergence between price and accumulation is one of the most bullish signals available, and it mirrors the pattern seen at the $15,500 bottom in late 2022 before Bitcoin rallied 700%.
U.S. Spot Bitcoin ETFs
The 12 U.S. spot Bitcoin ETFs, led by BlackRock’s iShares Bitcoin Trust (IBIT), Fidelity’s Wise Origin Bitcoin Fund (FBTC), and ARK 21Shares Bitcoin ETF (ARKB), now collectively hold approximately ~1.29 million BTC valued at roughly $89 billion. That represents about 6.1% of total Bitcoin supply, when the products were barely a year old. On February 2, 2026 alone, net ETF inflows hit $560 million, a clear signal that institutional allocators were buying the fear.
Corporate Treasury Accumulation
Digital asset treasuries (companies that hold Bitcoin on their balance sheets) collectively hold 1.09 million BTC ($109.72 billion). The leader remains Strategy (formerly MicroStrategy, MSTR), which has continued its aggressive accumulation strategy through convertible notes and equity offerings. CEO Michael Saylor’s conviction trade has turned the company into a leveraged Bitcoin proxy, and his continued buying during the drawdown has provided a psychological floor for the broader market.
Beyond Strategy, companies like Tesla, Block (SQ), and Marathon Digital hold significant BTC reserves. The corporate treasury trend has created a structural demand floor that did not exist in prior cycles, these are not traders flipping positions, but strategic allocators with multi-year horizons who view dips as buying opportunities.
Bitcoin Price Prediction, 2026, 2027, 2030
Analyst forecasts for Bitcoin have never been more polarized. The divergence between bull and bear cases is wider than at any point in Bitcoin’s history, reflecting genuine uncertainty about whether institutional demand has permanently altered the asset’s cyclical behavior.
| Source | 2026 | 2027 | 2030 |
|---|---|---|---|
| Standard Chartered | $150K–$200K | $400K | — |
| Ark Invest (Cathie Wood) | — | — | $1M+ |
| Coinpedia | $150K–$230K | $170K–$330K | $380K–$900K |
| CoinDesk (bear case) | −30% more | — | — |
Bull Case: $120,000–$200,000 by Year-End
The bull scenario required two catalysts: a ceasefire in the Iran conflict and at least one Fed rate cut in the second half of 2026. The first catalyst arrived on April 8, when the ceasefire crashed oil from $110 to $96 and triggered the risk-on rotation bulls had been waiting for. Standard Chartered’s team projects Bitcoin reaching $150,000–$200,000 if the second catalyst (a Fed cut) materializes later this year, driven by ETF inflow acceleration, the post-halving supply squeeze, and Bitcoin’s historical tendency to rally violently once macro headwinds clear. The precedent is compelling: after the March 2020 COVID crash, Bitcoin went from $3,800 to $64,000 in 13 months once the Fed pivoted to easing. With one of the two required catalysts now in play, the bull case has strengthened considerably.
Bear Case: $40,000–$45,000 if the 4-Year Cycle Holds
The bear case now hinges less on geopolitical escalation (the ceasefire has de-risked that scenario) and more on whether the 4-year cycle reasserts itself through pure market mechanics. If the Fed hikes at the April 28–29 meeting, or if the ceasefire collapses and oil re-spikes above $120, Bitcoin could still decline 30–40% from current levels. A move to the $40,000–$45,000 range would represent approximately a 65% decline from the ATH, milder than the 78–84% drawdowns of previous cycles. Some analysts view this as the “institutional floor” — the level where ETF and corporate treasury buyers step in aggressively enough to arrest the decline.
Base Case: $80,000–$100,000 by Year-End
The most probable outcome — and one that gained significant credibility after the April 8 ceasefire — is a gradual recovery toward $80,000–$100,000 by December 2026. The ceasefire has already lowered oil from $110 to $96; if it holds and oil drifts toward $85–$90, the inflation impulse fades and the Fed can hold steady without hiking. Combined with continued ETF inflows, this scenario sees Bitcoin establish a higher floor in the $70,000–$78,000 range and potentially retest $100,000 before year-end. This aligns with Raoul Pal’s extended cycle thesis and accounts for the structural demand from institutional allocators who are unlikely to liquidate positions during temporary drawdowns.
Key Levels and What to Watch
Support Levels
$60,000 has emerged as the strongest support of this cycle. Every test of this level over the past 50 days has attracted immediate buying, visible on-chain as large wallet inflows spike within hours of price touching $60K. Below that, $54,000 represents the cycle low (hit briefly in January) and aligns with the 200-week moving average, which has historically served as the ultimate bear market floor in every previous cycle.
Resistance Levels
On the upside, $70,000–$72,000 is the immediate resistance zone, a cluster of the 50-day moving average, the upper Bollinger Band, and significant options open interest. A clean break above $72,000 on strong volume would likely trigger a rapid move toward $80,000, where the 200-day moving average sits. Beyond that, the next major resistance is the psychological $100,000 level.
Catalysts to Watch
April 8 ceasefire (just happened): Iran agreed to reopen the Strait of Hormuz, and Brent crude crashed from $110 to $96 within hours. Bitcoin rallied from $69,000 to $72,000 on the news. The key question now is whether the ceasefire holds; any collapse would immediately reverse the risk-on trade.
April 28–29: FOMC meeting. With oil crashing post-ceasefire, the case for a rate hike has weakened, but markets are still pricing meaningful odds. A hold (or dovish language hinting at future cuts) would be the second catalyst the bull case needs; a surprise hike would slam the brakes on the recovery.
Q1 earnings season (April–May): Watch for miner profitability reports. If Bitcoin-mining companies report accelerating AI pivots and BTC reserve drawdowns, selling pressure intensifies. Conversely, if mining margins stabilize, the structural selling abates.
Miner economics: The Bitcoin hashrate remains near all-time highs despite the price decline, indicating that large-scale miners are still profitable. However, the hashprice (revenue per unit of computing power) has fallen to levels that typically trigger capitulation among smaller operators. When inefficient miners shut down, it often marks the bottom of a cycle.
How Bitcoin Compares to Other Assets in 2026
Bitcoin’s underperformance in 2026 contrasts sharply with traditional safe havens and commodity plays. The divergence highlights that in a genuine geopolitical crisis with real-world economic consequences, Bitcoin has traded as a high-beta tech proxy rather than a store of value.
| Asset | YTD Return | Trend |
|---|---|---|
| Gold (XAU) | +20% | Near record highs |
| Energy (XLE) | +30% | Pulling back on ceasefire |
| Oil (Brent) | +29% | Post-ceasefire pullback |
| S&P 500 | −7% | Recovering on ceasefire |
| Nasdaq | −10% | Correction (improving) |
| Bitcoin (BTC) | −19% | Testing resistance |
The divergence is narrowing but still stark. Gold has outperformed BTC by roughly 39 percentage points year-to-date. Energy stocks have outperformed by 49 percentage points. Even the recovering Nasdaq has fared better. This does not mean Bitcoin’s investment thesis is broken, but it confirms that during a genuine geopolitical crisis, the asset traded as a high-beta tech proxy rather than a store of value. The de-dollarization thesis remains a long-term structural argument. What the ceasefire rally demonstrates is that Bitcoin’s high beta works in both directions; the same volatility that amplified losses is now amplifying the recovery.
The ceasefire has already begun to validate the contrarian thesis. Bitcoin’s high beta is working in reverse; the 4.5% rally from $69,000 to $72,095 in the hours following the ceasefire announcement outpaced the S&P 500’s recovery move. The asset’s −43% drawdown from the ATH has priced in significant pain, and at $72,095, the risk/reward profile remains attractive for investors with a 12-month horizon, particularly if the Fed pivots dovish later this year.
What is Bitcoin’s price today?
Bitcoin is trading at approximately $72,095 as of April 9, 2026 — down 43% from its all-time high of $126,200 set in October 2025. BTC rallied from $69,000 after the April 8 Iran ceasefire triggered a risk-on rotation, and is now testing the $72,000 resistance zone that capped rallies for 50 days. Market sentiment has improved from Extreme Fear to Fear.
Will Bitcoin reach $100,000 again in 2026?
The odds improved significantly after the April 8 ceasefire. The bull case required two catalysts: a geopolitical de-escalation (now achieved) and a Fed rate cut in the second half of 2026. Standard Chartered targets $150,000–$200,000 if both materialize. The base case projects $80,000–$100,000 by year-end, which gained credibility with oil crashing from $110 to $96. The bear case (another 30% decline) now requires either a ceasefire collapse or a surprise Fed rate hike.
Is Bitcoin in a bear market?
Bitcoin remains 43% below its all-time high and 19% down year-to-date, technically still in bear market territory. However, the April 8 ceasefire rally and improving sentiment suggest the worst may be behind. Institutional demand from U.S. spot ETFs managing ~1.29 million BTC continues to provide a structural floor. Whale accumulation at these levels, combined with the ceasefire catalyst, suggests the market may be transitioning from a bear phase to an early recovery.
What is the Bitcoin halving cycle and is it still relevant?
The Bitcoin halving is a programmed event that cuts the mining reward in half approximately every four years — the most recent occurred in April 2024, reducing the reward from 6.25 to 3.125 BTC per block. Historically, each halving has triggered a bull run in the following 12–18 months, followed by a severe crash. There is growing debate about whether institutional adoption through ETFs and corporate treasuries has broken this pattern. Amberdata argues the halving cycle is over, replaced by an institutional flow cycle. The traditional view predicts a 2026 crash similar to 2018 and 2022.
Should I buy Bitcoin now?
This publication does not provide personalized investment advice. What the data shows: Bitcoin at $72,095 is 43% below its all-time high, one of two bull-case catalysts (the ceasefire) has materialized, and institutional accumulation continues accelerating. Many financial advisors recommend a dollar-cost averaging (DCA) approach — investing fixed amounts at regular intervals rather than trying to time the bottom. Never invest more than you can afford to lose, and consider consulting a registered financial advisor for guidance specific to your situation.
Last updated: April 9, 2026 at 1:00 PM ET. All data reflects real-time and closing session figures as indicated. This article is updated regularly — bookmark this page for the latest Bitcoin analysis.
For today’s live Bitcoin price, real-time chart, and daily market analysis, see our Bitcoin Price Today tracker.
Disclaimer: This article is for informational purposes only and does not constitute financial, investment, or trading advice. Cryptocurrency markets are highly volatile and past performance does not guarantee future results. Always conduct your own research and consult with a qualified financial advisor before making investment decisions. TECHi and its authors may hold positions in the assets discussed.