Moody’s Analytics proprietary AI recession model now sits at 49% — a single percentage point below the 50% threshold that has preceded every U.S. recession in the past 80 years. That number alone should command attention. But the picture gets darker when stacked against Goldman Sachs at 30%, EY Parthenon at 40%, and HSBC’s market-implied reading at 35%. With oil prices surging past $112 on Strait of Hormuz disruptions, consumer sentiment cratering to 53.3, and the S&P 500 shedding 1.67% in a single session, the question has shifted from if a recession is coming to how soon — and how severe.
Key Takeaways
- Recession Odds Surging Moody's AI recession model sits at 49% — one tick from the 50% threshold that preceded every U.S. recession in 80 years. Goldman Sachs is at 30%, EY Parthenon at 40%.
- Oil Shock Driving Crisis Brent crude at $112.57 with Strait of Hormuz effectively closed. Every $10 oil increase shaves 0.2–0.3% from GDP and adds 0.4% to inflation.
- Fed Trapped The Fed rate sits at 3.50–3.75% with CME FedWatch showing >50% probability of a rate hike. Cutting risks inflation; hiking risks recession — the classic stagflation trap.
- Defensive Positioning Required Shift toward short-duration Treasuries, gold, energy equities, and TIPS. Maintain 10% cash for buying opportunities during panic-driven selloffs.
- Critical Dates Ahead April 4 jobs report, April 6 Iran deadline, April 10 CPI, and April 28–29 FOMC meeting — four binary events in 30 days that will determine the recession trajectory.
Table of Contents
The Recession Scoreboard: Who Says What
Recession probability estimates have surged across Wall Street and the global macro community in the span of just a few weeks. The catalyst: a toxic cocktail of geopolitical escalation, a commodity supply shock, and stubbornly elevated inflation that has cornered the Federal Reserve.
Understanding where the major forecasters stand — and what drives their models — provides the clearest snapshot of the risk environment heading into Q2 2026.
| Institution | Recession Probability | Change | Primary Driver | Date Updated |
|---|---|---|---|---|
| Moody’s Analytics (AI Model) | 49% | +12 pts (from 37%) | Oil shock + consumer stress | March 25, 2026 |
| EY Parthenon | 40% | +10 pts (from 30%) | Stagflation risk, tight policy | March 24, 2026 |
| HSBC (Market-Implied) | 35% | +25 pts (from 10%) | Credit spreads, yield curve | March 25, 2026 |
| Goldman Sachs | 30% | +5 pts (from 25%) | Oil-driven inflation, tariff drag | March 25, 2026 |
| CME FedWatch (Implied) | >50% rate hike probability | Shift from rate cut bias | Inflation expectations unanchored | March 27, 2026 |
The most alarming reading belongs to Moody’s. The firm’s machine-learning model has correctly preceded every recession since 1945 once it crossed the 50% line. At 49%, the economy is one bad data print — or one more geopolitical escalation — from crossing that historical tripwire.
Goldman Sachs raised its estimate from 25% to 30%, citing the dual-track headwinds of an oil supply shock and tariff escalation with China. HSBC’s jump — the steepest in the group — reflects credit market pricing rather than a subjective call. When bond traders move this aggressively, the signal deserves weight.
Recession vs. Stagflation: The Debate That Matters
The economic discourse has shifted in a meaningful way over the past two weeks. The word “stagflation” — a portmanteau of stagnation and inflation — has re-entered the financial lexicon for the first time since the 1970s oil embargo era.
A recession is technically defined as two consecutive quarters of negative GDP growth, though the National Bureau of Economic Research (NBER) uses a broader set of criteria including employment, industrial production, and real personal income. The key feature: demand collapses, unemployment rises, and inflation typically falls as economic activity contracts.
Stagflation is the far more dangerous variant. Growth stalls or contracts while inflation accelerates — a combination that strips the Federal Reserve of its most powerful tool. Normally, the Fed can cut rates to stimulate growth. In a stagflationary environment, cutting rates risks pouring gasoline on an inflation fire. Raising rates risks tipping the economy into a deeper contraction.
Fed Chair Jerome Powell has explicitly rejected the stagflation label, pointing to still-positive GDP growth and a labor market that, while cooling, has not deteriorated sharply. But the data tells a more uncomfortable story:
- The OECD has revised its U.S. inflation forecast upward to 4.2% (from 2.8%), driven almost entirely by the energy shock
- Michigan consumer inflation expectations have climbed to 3.8%, well above the Fed’s 2% target
- CME FedWatch now prices greater than 50% probability of a rate hike — a stunning reversal from the rate-cut expectations that dominated just weeks ago
HSBC’s global research team offers a contrarian but credible view: the current environment more closely resembles a supply-side inflation shock than true stagflation. The distinction matters. Supply shocks — think oil embargo, pandemic bottlenecks — tend to be self-correcting once the supply disruption resolves. True stagflation (the 1974–1982 variety) requires deeply embedded inflationary psychology combined with structural labor market rigidity.
The problem: whether this is a temporary supply shock or the opening act of genuine stagflation depends almost entirely on whether the Iran-Hormuz crisis escalates or de-escalates. That makes the April 6 diplomatic deadline the single most important variable in the global macro outlook.
Five Warning Signs Flashing Red
1. Consumer Sentiment Has Cratered
The University of Michigan Consumer Sentiment Index fell to 53.3 in March 2026 — a level historically associated with either an active recession or the immediate approach of one. For context, this reading sat above 70 as recently as late 2025.
Consumer sentiment matters because consumption drives roughly 70% of U.S. GDP. When households feel poorer, they spend less. When they expect inflation to persist (and at 3.8% expected inflation, they clearly do), they pull forward purchases of durables and cut discretionary spending — a behavioral pattern that accelerates the very downturn they fear.
A YouGov poll from March 2026 found that 40% of Americans believe an “economic collapse” is coming. Whether that fear is proportionate to the actual risk is almost irrelevant — in economics, expectations become self-fulfilling.
2. The Oil Shock Is Real and Getting Worse
Brent crude has surged to $112.57 per barrel. WTI sits at $99.64. These are levels not seen since the immediate aftermath of Russia’s invasion of Ukraine in early 2022.
The driver is not ordinary OPEC+ supply management. The Strait of Hormuz — through which roughly 20% of global oil supply transits daily — has effectively been closed following the escalation of the Iran conflict. Houthi forces have entered the war, further disrupting Red Sea and Persian Gulf shipping lanes. The Trump administration’s April 6 deadline for Iran adds a binary risk event: either diplomacy succeeds and oil prices collapse, or it fails and prices move toward $130+.
Every $10 increase in oil prices historically shaves approximately 0.2–0.3% from U.S. GDP growth and adds roughly 0.4% to headline CPI. The move from $75 (early 2026 levels) to $112 represents a cumulative GDP drag that approaches recessionary territory on its own, even before accounting for the second-round effects on consumer behavior and business investment.
Investors looking at energy exposure should review the best oil stocks positioned to benefit from elevated crude prices — though the asymmetric risk of a diplomatic resolution creating a sharp selloff warrants careful position sizing.
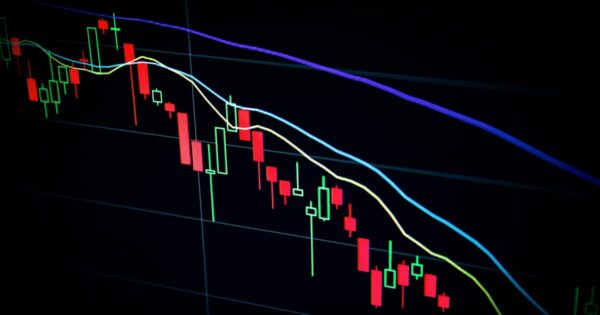
3. The VIX Says Markets Are Afraid
The CBOE Volatility Index (VIX) has spiked to 31.05 — well above the 20 level that typically demarcates complacency from fear. Readings above 30 have historically clustered around major market dislocations: the 2008 financial crisis, the 2020 COVID crash, the 2022 bear market.
A sustained VIX above 30 functions as both a symptom and a cause. It signals that options traders are paying steep premiums for downside protection, which in turn raises the cost of hedging across the financial system. This tightens financial conditions in a way that does not show up in the Fed funds rate but absolutely shows up in credit availability and risk appetite.
The VIX at 31.05 combined with gold at $4,524 tells a clear story: capital is rotating into safe-haven assets at an accelerating pace.
4. The Yield Curve Is Sending Mixed Signals
The 10-year Treasury yield at 4.44% reflects a market that is simultaneously pricing in persistent inflation (which pushes long rates higher) and rising recession risk (which would normally push them lower). This tug-of-war has created an unusual pattern where the curve remains relatively flat rather than displaying the deep inversion that preceded the 2008 and 2020 downturns.
Historically, yield curve inversions have preceded every U.S. recession since 1970 with a lead time of 6–18 months. The 2-year/10-year spread inverted in mid-2025 and has since partially un-inverted — a phenomenon known as “bear steepening” that some economists consider an even more reliable recession signal than the initial inversion itself.
The bond market is not pricing in a soft landing. It is pricing in a Fed that has lost the inflation narrative and may be forced to raise rates into weakening growth — the textbook definition of a policy mistake.
5. The Fed Is Trapped
The federal funds rate stands at 3.50–3.75%. Six months ago, the consensus expectation was for continued rate cuts toward a terminal rate below 3%. That narrative is dead.
The CME FedWatch tool now shows greater than 50% probability of a rate hike at an upcoming meeting — a complete 180-degree reversal that reflects the market’s assessment that the Fed will be forced to prioritize inflation over growth.
This is the policy trap that defines a stagflationary environment:
- Cut rates → Inflation accelerates further, dollar weakens, oil priced in dollars gets even more expensive
- Raise rates → Housing market freezes, corporate borrowing costs spike, layoffs accelerate
- Hold rates → Markets lose confidence in the Fed’s ability to manage either risk
The next FOMC meeting on April 28–29 represents the most consequential monetary policy decision since the emergency rate cuts of March 2020. The statement, the dot plot, and Powell’s press conference will move markets violently regardless of the decision.
Historical Comparison: 2026 vs. Past Recessions
Context matters. Comparing the current environment to previous recessionary periods reveals both alarming parallels and meaningful differences. The table below maps the key macro variables across four episodes: today’s environment, the 2008 Global Financial Crisis, the 2020 COVID recession, and the 1973 oil embargo recession that triggered the worst stagflationary period in modern U.S. history.
| Indicator | March 2026 | 2008 (GFC) | 2020 (COVID) | 1973 (Oil Embargo) |
|---|---|---|---|---|
| Trigger | Oil shock + geopolitical escalation | Housing/credit bubble | Pandemic lockdowns | OPEC oil embargo |
| Oil Price | $112.57 (Brent) | $147 (peak) | $20 (trough) | $12 → $52 (quadrupled) |
| Fed Funds Rate | 3.50–3.75% | 5.25% → 0% | 1.75% → 0% | 10% → 13% |
| Inflation (CPI) | ~4.2% (OECD est.) | 5.6% (peak) | 1.2% | 12.3% |
| VIX (Peak) | 31.05 (current) | 80+ (Oct 2008) | 82 (March 2020) | N/A (VIX est. 1993) |
| S&P 500 Peak-to-Trough | -8.2% (YTD from high) | -56.8% | -33.9% | -48.2% |
| Unemployment | ~4.1% (est.) | 10.0% (peak) | 14.7% (peak) | 9.0% (peak) |
| Recovery Time (S&P) | TBD | ~4 years | ~5 months | ~7 years |
| Dollar Trend | Weakening (de-dollarization) | Strengthening (flight to safety) | Strengthening | Weakening sharply |
The closest historical analog to 2026 is 1973, not 2008 or 2020. Both episodes share the same DNA: an oil supply shock driven by geopolitical conflict in the Middle East, a Federal Reserve that was already behind the inflation curve, and a weakening dollar that amplified the inflationary impulse.
The critical difference: in 1973, the U.S. was far more dependent on Middle Eastern oil imports than it is today. American shale production provides a partial buffer. However, oil is a globally priced commodity — even domestically produced crude reprices to reflect global supply disruptions. The benefit of energy independence is strategic, not economic, in a supply shock scenario.
The 2008 comparison is less instructive because the financial system’s plumbing — bank capital ratios, leverage limits, mortgage underwriting standards — is fundamentally healthier today. There is no subprime-equivalent bomb embedded in the banking sector. The risk in 2026 is macro, not systemic.
What Happens to Your Portfolio in a Recession
The S&P 500 closed at 6,368.85 — its fifth consecutive losing week — down 1.67% in a single session. The Dow Jones Industrial Average fell 793 points to 45,166.64, officially entering correction territory. The Nasdaq Composite dropped 2.15% to 20,948, with tech stocks bearing the brunt of the selloff.
Historical drawdown data reveals what investors should expect if the current environment deteriorates into a full recession:
- Mild recession (2001-type): S&P 500 drawdown of -25% to -35%, recovery in 2–3 years
- Moderate recession (1990-type): Drawdown of -20% to -30%, recovery in 12–18 months
- Severe recession (2008-type): Drawdown of -40% to -57%, recovery in 3–5 years
- Stagflationary recession (1973-type): Drawdown of -45% to -50%, recovery in 5–7 years with significant inflation erosion of real returns
The last scenario is the most damaging because inflation erodes the purchasing power of portfolios even during the recovery phase. A nominal recovery to break-even after a 50% drawdown requires a 100% gain — but if inflation runs at 5% annually during that recovery period, the real break-even point is pushed out by an additional 2–3 years.
Growth stocks — particularly high-multiple AI stocks and speculative tech — face the steepest declines in a rising-rate, slowing-growth environment. Stocks like Nvidia and Tesla, which trade on future earnings expectations, see those expected earnings discounted at higher rates, compressing valuations even if the underlying business remains strong.
Defensive sectors — utilities, consumer staples, healthcare — historically outperform on a relative basis during recessions, though they still typically deliver negative absolute returns. The only asset class that consistently delivers positive nominal returns during stagflationary recessions is commodities, particularly gold and energy.
The Recession-Proof Portfolio
No portfolio is truly “recession-proof” — but allocations can be structured to minimize drawdowns while maintaining exposure to the eventual recovery. The following framework reflects a defensive positioning appropriate for an environment where recession probability exceeds 35% and stagflation risk is elevated.
| Asset Class | Allocation | Rationale | Instruments |
|---|---|---|---|
| Short-Duration Treasuries | 25% | Capital preservation, yield above inflation at current rates | SHY, BIL, T-bills |
| Gold & Precious Metals | 15% | Inflation hedge, safe haven, dollar debasement protection | GLD, IAU, physical gold |
| Energy Equities | 15% | Direct beneficiary of elevated oil, strong cash flows | XLE, top oil stocks |
| Defensive Equities | 15% | Stable earnings, dividends, low beta | XLU, XLP, XLV, dividend aristocrats |
| TIPS (Inflation-Protected) | 10% | Direct inflation protection with government backing | TIP, SCHP |
| International Diversification | 10% | Dollar weakening benefits foreign-denominated returns | VXUS, EFA (hedged selectively) |
| Cash & Equivalents | 10% | Dry powder for buying opportunities during panic selling | Money market, SGOV |
This allocation prioritizes real return preservation over nominal growth. The 25% allocation to short-duration Treasuries provides ballast and liquidity. The combined 15% gold and 10% TIPS allocation addresses the stagflation risk directly. Energy equities serve a dual purpose: they hedge the oil shock while generating substantial free cash flow at current prices.
The 10% cash allocation is arguably the most important component. Recessions create generational buying opportunities. The investors who had liquid capital available in March 2009, March 2020, and October 2022 earned extraordinary returns by deploying into fear. Having cash available when others are forced to sell is a structural advantage that cannot be overstated.
Notably absent from this allocation: high-growth tech, speculative assets, and Bitcoin. While digital assets have occasionally shown decorrelation with traditional markets, their behavior during the 2022 bear market — declining in lockstep with risk assets — suggests they are not yet reliable recession hedges. This allocation can be revisited once the macro picture clarifies.
The Bull Case: Why a Recession May Not Happen
Recession is not a foregone conclusion. Even at 49%, the Moody’s model assigns a 51% probability to no recession. The bull case rests on several concrete catalysts that could reverse the current trajectory.
AI Capital Expenditure Is Accelerating. Despite the macro headwinds, corporate spending on artificial intelligence infrastructure continues to surge. The hyperscalers — Microsoft, Google, Amazon, Meta — have collectively committed over $250 billion in AI-related capital expenditure for 2026. This spending creates real economic activity: construction of data centers, procurement of semiconductors, hiring of engineers and technicians. The AI capex cycle functions as a private-sector fiscal stimulus that partially offsets the drag from higher oil prices and tighter monetary policy.
The TACO Thesis. Goldman’s equity strategy team has coined the “TACO” framework — Tariffs Are Cyclical and Overpriced — arguing that markets have over-discounted the impact of trade policy on corporate earnings. The thesis: tariff impacts are absorbed through supply chain adjustments within 2–3 quarters, and the current selloff has priced in a worst-case scenario that is unlikely to materialize in full.
Diplomatic Resolution Is Possible. The April 6 deadline, while creating a binary risk event, also creates a framework for resolution. Backchannels between Washington and Tehran have reportedly remained active. A de-escalation would trigger a sharp reversal in oil prices — potentially back toward $80–85 — which would immediately relieve the inflationary pressure that is the primary driver of recession fears. The domino effect: lower oil → lower inflation expectations → Fed can hold or cut rates → consumer confidence recovers → equity markets rally.
The Labor Market Remains Solid. Despite all the fear in sentiment surveys, the actual employment data has not deteriorated dramatically. Initial jobless claims remain below 250,000. The unemployment rate is still in the low 4% range. Wage growth continues to outpace pre-pandemic norms. Until the labor market cracks — and it has not yet — the consumer has the income support necessary to continue spending, even if at a reduced pace.
Corporate Balance Sheets Are Strong. Unlike 2008, when corporate leverage was stretched and cash reserves were thin, today’s S&P 500 companies are sitting on record cash positions with manageable debt maturity schedules. Refinancing risk — the silent killer of overleveraged companies during rate-hiking cycles — is contained. Defaults are likely to remain low even if rates move higher.
What to Watch Next: Key Dates and Catalysts
The next 30 days contain more binary risk events than any comparable period in recent memory. Each of the following dates has the potential to decisively shift the recession probability in either direction.
| Date | Event | Why It Matters | Market Impact |
|---|---|---|---|
| April 4, 2026 | March Non-Farm Payrolls (BLS) | First hard data on labor market health post-oil shock. A print below 100K would spike recession odds dramatically. | High — directional for equities and bonds |
| April 6, 2026 | Trump Iran Diplomatic Deadline | Binary geopolitical event. Resolution → oil collapses toward $85. Escalation → oil tests $130+. This is the single highest-impact event on the calendar. | Extreme — affects every asset class simultaneously |
| April 10, 2026 | March CPI Report | Will capture the initial oil price pass-through. A reading above 4.5% would cement rate hike expectations and further trap the Fed. | High — defines Fed path for Q2 |
| April 28–29, 2026 | FOMC Meeting & Decision | Most consequential Fed meeting since March 2020. The decision (hold/hike), dot plot, and Powell press conference will set the tone for the rest of 2026. | Extreme — volatility guaranteed |
| Ongoing | China Trade Probe / Tariff Escalation | A second front in the trade war would compound the supply shock and add further inflationary pressure. Watch for retaliatory tariffs on semiconductors and rare earths. | Medium-High — cumulative drag on sentiment |
The April 4 payrolls report deserves special attention because it will be the first hard economic data point that captures the behavioral response to the oil shock and geopolitical escalation. Soft data (sentiment surveys, PMIs) has already deteriorated sharply. If the hard data confirms what the soft data is signaling, the recession narrative will shift from “possible” to “probable” in the space of a single morning.
For investors: the optimal strategy over the next 30 days is to reduce position sizes, increase hedges, maintain cash reserves, and avoid trying to predict the outcome of binary events. The April 6 Iran deadline alone could move the S&P 500 by 5% or more in either direction within hours. Position for both scenarios rather than betting on one.
Track all key developments daily on TECHi’s stock market today page for real-time analysis as these catalysts unfold.
Are we heading into a recession in 2026?
Recession probability has risen sharply across all major forecasters. Moodyu0027s AI model sits at 49%, Goldman Sachs at 30%, EY Parthenon at 40%, and HSBCu0027s market-implied probability at 35%. While a recession is not certain, the combination of an oil supply shock from the Iran-Hormuz crisis, inflation re-accelerating toward 4.2%, and a Federal Reserve trapped between raising rates and protecting growth has created the most precarious macro environment since 2008. The next 30 days — particularly the April 4 jobs report, April 6 Iran deadline, and April 28 FOMC meeting — will likely determine whether these elevated probabilities translate into an actual downturn.
What is the difference between a recession and stagflation?
A recession is defined as two consecutive quarters of negative GDP growth, typically accompanied by rising unemployment and falling inflation. Stagflation is a far more damaging scenario where economic growth stalls or declines while inflation simultaneously accelerates. The current environment shows elements of both: consumer sentiment has cratered to 53.3, oil prices have surged above $112, and the OECD has raised its U.S. inflation forecast to 4.2%. Fed Chair Powell has rejected the stagflation label, but the data increasingly supports the possibility that the U.S. faces a supply-side inflation shock that could evolve into stagflation if the Iran crisis persists.
How should investors protect their portfolios from a recession?
A defensive portfolio allocation emphasizes capital preservation and inflation protection. Consider shifting toward short-duration Treasuries (25%), gold and precious metals (15%), energy equities (15%), defensive stocks like utilities and healthcare (15%), TIPS (10%), international diversification (10%), and maintaining 10% in cash for buying opportunities during market dislocations. Reduce exposure to high-growth tech stocks and speculative assets, which face the steepest declines in rising-rate, slowing-growth environments. The single most important step: maintain cash reserves so you can deploy capital during panic-driven selloffs that historically create generational buying opportunities.
Why are oil prices driving recession fears in 2026?
Brent crude has surged to $112.57 per barrel following the effective closure of the Strait of Hormuz, through which approximately 20% of global oil supply transits. The Iran conflict, Houthi disruption of Red Sea shipping, and Trumpu0027s April 6 diplomatic deadline have created a supply shock. Every $10 increase in oil prices historically shaves 0.2–0.3% from U.S. GDP growth and adds roughly 0.4% to headline inflation. The move from $75 to $112 represents a cumulative GDP drag that approaches recessionary territory even before accounting for the second-round effects on consumer spending and business investment.
What is the bull case against a recession happening?
Goldman Sachs maintains an Su0026amp;P 500 year-end target of 6,800, citing several catalysts: over $250 billion in AI capital expenditure from hyperscalers creating private-sector stimulus, the possibility of diplomatic resolution with Iran that would crash oil prices back toward $85, a still-solid labor market with unemployment in the low 4% range, and strong corporate balance sheets with record cash positions. Goldmanu0027s TACO thesis (Tariffs Are Cyclical and Overpriced) argues markets have over-discounted trade policy impacts. The key insight: even Moodyu0027s 49% reading means there is a 51% probability of avoiding recession altogether.
Disclaimer: This article is for informational and educational purposes only and does not constitute financial, investment, or tax advice. All data referenced reflects conditions as of the publication date and is subject to change. Past performance is not indicative of future results. Investing involves risk, including the possible loss of principal. Consult a qualified financial advisor before making any investment decisions. TECHi and its authors may hold positions in securities mentioned in this article.