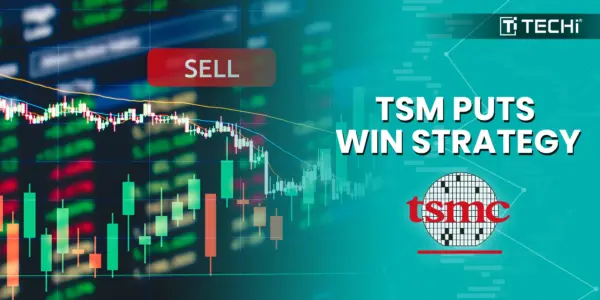
Every time you unlock your iPhone, ask ChatGPT a question, or watch an Nvidia-powered AI model generate a video from a text prompt, you’re relying on silicon manufactured by one company. Not Nvidia. Not Apple. Not Intel. Taiwan Semiconductor Manufacturing Company (NYSE: TSM) — the $1.76 trillion foundry that fabricates the world’s most advanced chips and now ranks as the sixth most valuable public company on Earth.
Yet most retail investors don’t own a single share.
That disconnect between TSMC’s dominance and its absence from typical portfolios is one of the most interesting mispricings in the market today. At $338.45 per share, TSM trades at 32.73x earnings while delivering 62.3% gross margins, 48.3% net margins, and revenue growth north of 25% — numbers that would make most SaaS companies jealous, let alone a capital-intensive manufacturer.
Here’s the full picture: what the numbers say, where the risks hide, and whether TSM belongs in your portfolio in 2026.
TSM at a Glance 🔗
| Metric | Value |
|---|---|
| Ticker | TSM (NYSE ADR) |
| Share Price | $338.45 (as of March 24, 2026) |
| 52-Week Range | $134.25 – $390.21 |
| Market Capitalization | $1.76 trillion (#6 globally) |
| P/E Ratio (TTM) | 32.73x |
| Earnings Per Share (EPS) | $10.34 |
| TTM Earnings | $88.34 billion |
| Dividend Yield | 0.91% ($3.08/share annually) |
| Gross Margin | 62.3% |
| Operating Margin | 54.0% |
| Net Margin | 48.3% |
| Analyst Consensus | Strong Buy (18 buy, 0 sell) |
| Average Price Target | $430.65 (+27.2% upside) |
| Next Earnings Report | April 16, 2026 |
Sources: Stock Analysis, Nasdaq Analyst Research, TSMC Investor Relations
Why TSMC Is the Most Important Company Most Investors Don’t Own 🔗
Think of the semiconductor industry as a three-layer stack. At the top, you have chip designers — Nvidia, Apple, AMD, Qualcomm — the names that grab headlines and dominate AI stock lists. In the middle sit the equipment makers like ASML, Applied Materials, and Lam Research. At the foundation, handling the actual manufacturing of virtually every cutting-edge processor? That’s TSMC. Alone.
The company controls 72% of the global semiconductor foundry market. For advanced nodes (sub-7nm), that share climbs even higher — north of 90% by most industry estimates. Every major fabless chip designer depends on TSMC to turn their transistor blueprints into physical silicon.
This creates a business model with extraordinary characteristics:
- Pricing power. When you’re the only foundry capable of manufacturing 3nm and 2nm chips at scale, customers don’t haggle over wafer prices. TSMC’s 62.3% gross margins in Q4 FY2025 reflect this reality.
- Visibility. Customers commit to wafer capacity 12-18 months in advance, giving TSMC unusual revenue predictability for a cyclical industry.
- Compounding advantages. Each technology node requires billions in R&D and capex. TSMC’s scale lets it spread those costs across a larger revenue base than any competitor, making it progressively harder for Samsung Foundry or Intel Foundry Services to close the gap.
For investors building a portfolio around tech stocks, TSMC sits at the chokepoint of the entire semiconductor value chain. Nvidia designs the GPUs. TSMC builds them. One doesn’t work without the other.
Q4 FY2025 Earnings Breakdown 🔗
TSMC’s fourth quarter of fiscal year 2025 confirmed what the market suspected: the AI spending cycle isn’t slowing down. Revenue came in at $33.73 billion, up 25.5% year-over-year — a staggering number for a company already operating at this scale. Net income surged even faster, with NT$505.74 billion representing 35% year-over-year growth, per the company’s Q4 earnings press release.
The margin expansion tells the real story:
| Margin Metric | Q4 FY2025 | Significance |
|---|---|---|
| Gross Margin | 62.3% | Indicates strong pricing power and manufacturing efficiency |
| Operating Margin | 54.0% | Operating expenses well-controlled despite R&D ramp |
| Net Margin | 48.3% | Nearly half of every revenue dollar drops to profit |
A 48.3% net margin at $33.73 billion in quarterly revenue means TSMC is converting roughly $16.3 billion into pure profit every three months. For context, that’s more quarterly profit than most S&P 500 companies generate in annual revenue.
AI accelerators represented high-teens percentage of FY2025 revenue — a segment growing rapidly as hyperscalers like Microsoft, Google, Amazon, and Meta race to build out AI infrastructure. This segment is TSMC’s fastest-growing end market and the primary catalyst behind the margin expansion, since AI chips tend to use the most advanced (and most expensive) process nodes.
The EPS figure of $10.34 feeds into the current 32.73x P/E ratio. On trailing twelve-month earnings of $88.34 billion, the market is valuing TSMC at roughly 20x TTM earnings on an enterprise basis — a reasonable multiple for a business growing revenue at 25%+ with expanding margins.
The AI Supercycle — TSMC’s $56 Billion Bet 🔗
If you want to understand where TSMC’s management sees the next five years heading, look at one number: $52-56 billion in capital expenditure guidance for FY2026.
That’s not a typo. TSMC plans to spend more on factories and equipment in a single year than the GDP of most countries. According to Futurum Group’s FY2026 outlook analysis, this capex is primarily directed at three areas:
- N2 (2nm) node ramp. TSMC’s next-generation process technology enters volume production in late 2025 and scales through 2026. The N2 node uses gate-all-around (GAA) transistor architecture — a fundamental shift from the FinFET design that has dominated since 14nm. Early yield data reportedly looks strong.
- N3 and N3E capacity expansion. The 3nm family remains TSMC’s current workhorse for flagship chips. Apple’s latest processors, Nvidia’s next-gen GPUs, and AMD’s data center chips all run on N3 variants. Demand continues to outstrip supply.
- Advanced packaging (CoWoS and SoIC). This is the sleeper story. AI chips like Nvidia’s Blackwell architecture require advanced packaging technologies to stack multiple chiplets together with high-bandwidth memory. TSMC’s CoWoS (Chip on Wafer on Substrate) capacity has been the primary bottleneck for AI chip production. Much of the capex increase targets packaging capacity, not just wafer fabrication.
The math works because AI chips carry premium pricing. An advanced CoWoS package for a large AI accelerator can generate 5-10x the revenue per wafer compared to a standard mobile processor. TSMC is investing where the margins are fattest.
For investors tracking the AI chip race between Broadcom and Nvidia, TSMC is the common denominator — both companies depend entirely on TSMC’s manufacturing capacity to deliver their products.
TSMC’s Competitive Moat — Why Nobody Can Catch Up 🔗
In semiconductor manufacturing, the gap between first and second place isn’t measured in inches. It’s measured in years and tens of billions of dollars.
TSMC’s 72% foundry market share understates its actual competitive position. In leading-edge manufacturing (7nm and below), TSMC’s effective share exceeds 90%. Here’s why the two nearest competitors haven’t been able to close the gap:
Samsung Foundry 🔗
Samsung has invested heavily in its foundry business but continues to struggle with yields on its 3nm GAA process. The company has lost key customers — most notably Qualcomm, which shifted premium chip orders back to TSMC after yield issues. Samsung’s foundry division operates at significantly lower margins than TSMC, creating a vicious cycle: lower margins mean less capital for R&D, which means the technology gap widens.
Intel Foundry Services (IFS) 🔗
Intel’s attempt to become a major foundry player under Pat Gelsinger’s IDM 2.0 strategy faces an uphill battle. Intel 18A (roughly equivalent to TSMC’s N2) has shown promising early results, but converting that into volume production with competitive yields takes time. Intel’s foundry business reported significant operating losses in 2025, and attracting external customers remains challenging when TSMC offers a proven track record spanning decades.
The Compounding Advantage 🔗
TSMC’s moat gets wider with each technology generation for a structural reason: the cost of building and equipping a cutting-edge fab now exceeds $20 billion. Only a company manufacturing at TSMC’s volume can spread that cost across enough wafers to generate positive returns. Samsung and Intel are essentially paying the same fixed costs while serving a fraction of the customer base.
This is the kind of competitive position that makes long-term investors pay attention. It shares characteristics with the monopoly-like business models found in companies across quantum computing and other emerging tech verticals — except TSMC’s dominance is already generating massive cash flows today.
The $50,000 TSMC Investment — A Real-World Example 🔗
Abstract percentages don’t hit the same way as actual dollar figures. Let’s run a concrete scenario with a $50,000 investment in TSM at today’s price of $338.45 per share.
Position Size 🔗
$50,000 / $338.45 = approximately 147 shares (with roughly $252 in cash remaining).
Scenario 1: Analyst Consensus Target ($430.65) 🔗
If TSM reaches the average Wall Street target of $430.65:
- 147 shares x $430.65 = $63,305
- Gain: +$13,305 (+26.6%)
- Plus annual dividend income: 147 shares x $3.08 = $452.76/year
Scenario 2: Bull Case Target ($520) 🔗
If TSM reaches the highest analyst target of $520:
- 147 shares x $520 = $76,440
- Gain: +$26,440 (+52.9%)
- Plus annual dividend income: $452.76/year
Scenario 3: Bear Case (price declines to $275) 🔗
Not every scenario is rosy. If geopolitical tensions escalate or the AI spending cycle slows:
- 147 shares x $275 = $40,425
- Loss: -$9,575 (-19.2%)
- Dividend provides partial offset: $452.76/year
Context: S&P 500 Comparison 🔗
The S&P 500 has historically returned roughly 10% annually over long time horizons. On a $50,000 investment, that’s approximately $5,000 in expected annual appreciation. The analyst consensus for TSM implies roughly 2.6x that return over the next 12 months — though individual stock returns carry materially higher variance than index returns.
The 0.91% dividend yield won’t make anyone rich, but the $452.76 annual income on this position is a tangible cash flow that compounds over time. TSMC has consistently grown its dividend, reflecting management’s confidence in sustaining earnings growth.
This scenario is for illustrative purposes only. Past performance and analyst forecasts do not guarantee future results. See the investment disclaimer at the bottom of this article.
Wall Street Consensus — What 18 Analysts Say 🔗
The analyst consensus on TSM is unusually one-sided. Per Nasdaq’s analyst research page:
| Rating Category | Count |
|---|---|
| Strong Buy / Buy | 18 |
| Hold | 0 |
| Sell / Strong Sell | 0 |
| Price Target | Value | Implied Return |
|---|---|---|
| High Target | $520.00 | +53.7% |
| Average Target | $430.65 | +27.2% |
| Low Target | $351.00 | +3.7% |
Zero sell ratings across 18 analysts is rare for any large-cap stock. Even the most conservative target of $351 implies modest upside from today’s $338.45 price. The consensus average of $430.65 suggests Wall Street sees meaningful room to run.
That said, analyst consensus should be one input in your analysis, not the final word. Analysts covering Palantir stock and other high-growth names have been both spectacularly right and spectacularly wrong in recent cycles. The value of the consensus here is the unanimity — nobody who covers TSMC professionally sees a reason to sell it.
Bull Case vs Bear Case 🔗
Any honest investment analysis needs to present both sides. Here’s where the arguments stand:
The Bull Case for TSM 🔗
- AI spending is still accelerating. Hyperscaler capex budgets for 2026 suggest AI infrastructure investment hasn’t peaked. Every dollar spent on AI hardware flows through TSMC’s fabs. The AI accelerator segment growing from high-teens to potentially 25%+ of revenue would meaningfully boost total growth.
- N2 node drives pricing uplift. Each new process node allows TSMC to charge higher wafer prices. The transition to N2 in 2026-2027 should support gross margin expansion above the current 62.3%.
- Advanced packaging is a second growth engine. CoWoS and 3D stacking technologies represent a new revenue stream that barely existed five years ago. As AI models grow larger and require more complex chip architectures, packaging revenue could become a substantial contributor.
- Geographic diversification. TSMC’s Arizona fabs and planned facilities in Japan and Germany reduce the Taiwan concentration risk that has historically capped the stock’s valuation multiple.
- Returning cash to shareholders. With $88.34 billion in TTM earnings and growing, TSMC has significant room to increase dividends and potentially initiate buybacks.
The Bear Case for TSM 🔗
- Geopolitical risk is real and unhedgeable. Over 80% of TSMC’s manufacturing capacity remains in Taiwan. A cross-strait conflict or even escalated tensions could devastate the stock regardless of fundamentals.
- AI spending could disappoint. If enterprise AI adoption slows or hyperscalers pull back capex after building excess capacity, TSMC’s fastest-growing segment takes a hit. The emergence of more efficient AI models like DeepSeek could reduce the total compute required.
- Cyclicality hasn’t been repealed. Semiconductors remain cyclical. TSMC’s premium valuation assumes continued growth; a demand correction would compress multiples quickly.
- Customer concentration. Apple and Nvidia together represent a large share of TSMC’s revenue. Losing or reducing business with either customer would be significant.
- Valuation isn’t cheap. At 32.73x earnings, TSM prices in substantial growth. If earnings growth decelerates to 15% instead of 25%+, the multiple could contract.
Risk Factors 🔗
Beyond the bull/bear framework, investors should understand these specific risks before buying TSM:
Taiwan Strait Geopolitics 🔗
This is the elephant in the room. Taiwan sits 100 miles from mainland China, and cross-strait relations remain the primary geopolitical risk for TSMC shareholders. While most analysts view a military conflict as low-probability, even saber-rattling episodes have triggered sharp selloffs in TSM. The stock’s 52-week range of $134.25 to $390.21 partially reflects this geopolitical volatility.
ASML Dependency 🔗
TSMC’s most advanced manufacturing processes require extreme ultraviolet (EUV) lithography machines made exclusively by ASML. Each machine costs roughly $350 million, and supply is constrained. Any disruption to ASML’s production — whether from supply chain issues, export controls, or natural disasters — directly limits TSMC’s ability to expand capacity.
Export Control Risks 🔗
U.S. restrictions on semiconductor technology exports to China create ongoing uncertainty. While TSMC has complied with existing controls, escalation could reduce TSMC’s addressable market and complicate its customer relationships with Chinese chip designers like HiSilicon.
Currency Exposure 🔗
TSMC reports in New Taiwan Dollars but generates significant revenue in U.S. dollars. ADR holders face an additional layer of currency risk. NT$/USD fluctuations can impact reported earnings independently of operational performance.
Capex Execution Risk 🔗
Spending $52-56 billion in a single year requires flawless execution across multiple geographies. The Arizona fab has already experienced delays and cost overruns. If new capacity comes online later than planned while demand stays strong, TSMC leaves money on the table. If demand softens while new capacity ramps, margins compress.
TSMC vs Nvidia vs Intel — Competitive Positioning 🔗
These three companies occupy different positions in the semiconductor ecosystem, but investors frequently compare them. Here’s how they stack up, as tracked in our coverage of Nvidia stock and tech stocks broadly:
| Metric | TSMC (TSM) | Nvidia (NVDA) | Intel (INTC) |
|---|---|---|---|
| Business Model | Pure-play foundry | Fabless chip designer | IDM (design + manufacturing) |
| Market Cap | $1.76T | ~$2.8T | ~$95B |
| Gross Margin | 62.3% | ~73% | ~40% |
| Net Margin | 48.3% | ~55% | ~2% |
| Revenue Growth (YoY) | +25.5% | ~70%+ | Flat to declining |
| AI Exposure | Manufactures all major AI chips | Designs dominant AI GPUs | Trying to compete in AI accelerators |
| Key Risk | Geopolitics (Taiwan) | Valuation, competition | Execution, market share loss |
| Dividend Yield | 0.91% | ~0.03% | ~1.5% |
| Analyst Consensus | Strong Buy (18/0) | Strong Buy | Hold |
The key insight: Nvidia gets the glory, but TSMC captures the margin. Without TSMC, Nvidia literally cannot ship GPUs. That supplier relationship is symbiotic — Nvidia needs TSMC’s manufacturing, and TSMC needs Nvidia’s design wins — but TSMC’s position is arguably more defensible because building a competing foundry takes a decade and $100+ billion.
Intel represents the cautionary tale. The company once dominated semiconductor manufacturing but fell behind TSMC by 2-3 process nodes. Despite massive investment, Intel’s foundry business remains years away from competing on equal terms. For investors evaluating whether to allocate capital to crypto or AI stocks, Intel’s struggles illustrate how quickly competitive advantages can erode in semiconductors — and why TSMC’s sustained leadership is so valuable.
How to Invest in TSM Stock 🔗
Buying TSMC shares is straightforward, but there are a few details worth knowing:
ADR vs Taiwan-Listed Shares 🔗
Most U.S. investors buy TSM through the American Depositary Receipt (ADR) listed on the New York Stock Exchange. Each ADR represents five shares of TSMC’s Taiwan-listed stock (ticker: 2330.TW). The ADR trades during U.S. market hours in U.S. dollars, making it functionally identical to buying any other NYSE stock.
If you have access to the Taiwan Stock Exchange through an international brokerage, you can buy the underlying shares directly. The main advantages are tighter spreads and avoiding the ADR depositary bank’s fees (typically small). For most investors, the ADR is the practical choice.
Where to Buy 🔗
TSM ADRs are available on virtually every major brokerage platform:
- Commission-free brokers: Fidelity, Charles Schwab, Robinhood, Interactive Brokers (IBKR Lite)
- Full-service brokers: Morgan Stanley, Merrill Lynch, UBS
- International brokers: Interactive Brokers (for Taiwan-listed shares)
Tax Considerations 🔗
TSMC dividends paid to U.S. ADR holders are subject to Taiwanese withholding tax (typically 21%), which can be partially offset by the U.S. foreign tax credit. Holding TSM in a tax-advantaged account (IRA, 401k) may result in losing the foreign tax credit, so consult a tax professional about optimal account placement.
TSMC’s SEC filings (20-F annual reports) provide the most detailed English-language financial disclosures for investors wanting to conduct their own due diligence.
Position Sizing 🔗
Given the geopolitical risk profile, many financial advisors suggest limiting single-stock exposure to 5-10% of a total portfolio. TSMC’s quality and growth characteristics may justify a position toward the upper end of that range for investors with higher risk tolerance, but the Taiwan concentration risk argues against making it an outsized bet. Diversifying across multiple AI stocks and semiconductor names can reduce single-company risk while maintaining exposure to the secular growth trend.
Frequently Asked Questions 🔗
Investment Disclaimer 🔗
The information presented here is for educational and informational purposes only. It does not constitute financial advice, investment recommendations, or an offer to buy or sell any securities. All investment scenarios, projections, and examples are hypothetical and based on data available as of March 24, 2026.
Investing in individual stocks involves substantial risk, including the potential loss of principal. Past performance does not guarantee future results. Analyst price targets and consensus ratings reflect opinions that may change and should not be relied upon as guarantees of future stock performance.
TSMC ADRs carry additional risks including currency fluctuations, geopolitical factors, and differences in regulatory frameworks between the United States and Taiwan. Investors should conduct their own due diligence and consult with a qualified financial advisor before making investment decisions.
TECHi and its authors may hold positions in securities mentioned here. For more information, please review our full editorial disclaimer and disclosure policy.
Data sources: TSMC Investor Relations, Nasdaq, Stock Analysis, SEC EDGAR.