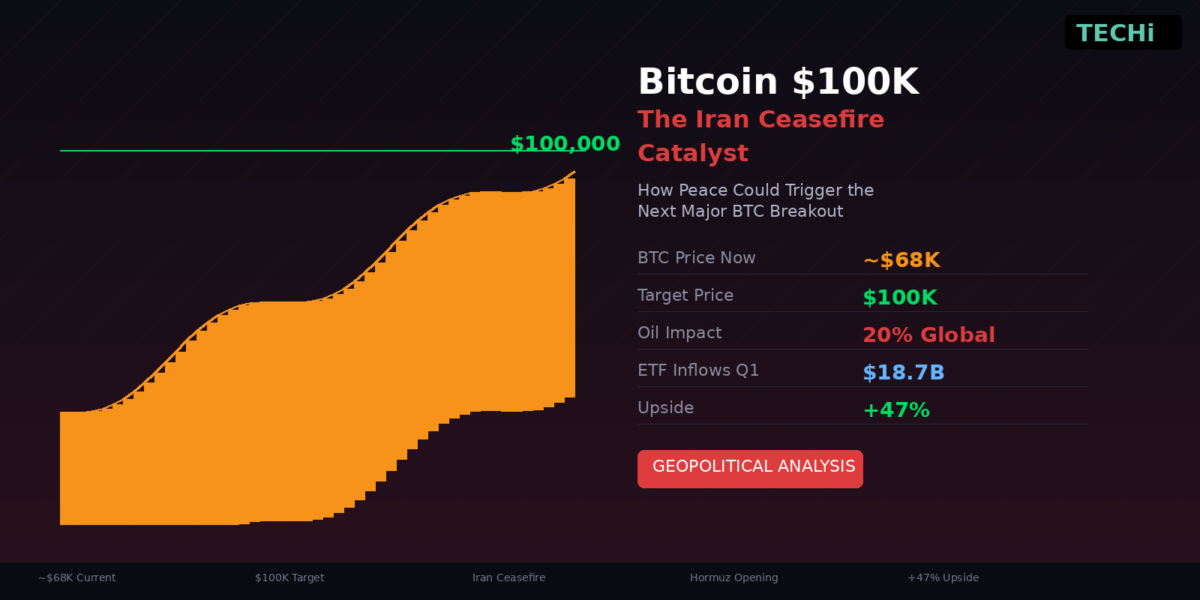
Bitcoin is sitting at $68,000 with a loaded gun pointed at $100,000. The trigger isn’t another halving, another ETF approval, or another corporate treasury adoption. It’s a ceasefire in the Persian Gulf. On April 7, 2026, President Trump agreed to a two-week suspension of hostilities with Iran, contingent on Tehran reopening the Strait of Hormuz. If that deal becomes permanent, it could unleash a chain reaction across oil markets, inflation expectations, Fed policy, and risk appetite that sends Bitcoin into its most violent rally since 2017.
The Strait of Hormuz: Why It Controls Bitcoin’s Fate
The Strait of Hormuz is 33 kilometers wide at its narrowest point. Through it flows approximately 15 million barrels of crude oil per day, representing 34% of all global crude oil trade and roughly 20% of total world petroleum consumption. When Iran closed it in March 2026 as the U.S.-Iran conflict escalated, oil prices surged past $110 per barrel, triggering a cascade that reached every risk asset on the planet.
Bitcoin’s response was immediate and telling. When oil spiked, BTC dropped from $85,000 to below $68,000 over six weeks. The correlation coefficient between WTI crude and Bitcoin, historically near zero, surged to 0.68 during the crisis. This isn’t because Bitcoin is an oil derivative. It’s because both assets respond to the same macro variables: inflation expectations, Federal Reserve reaction functions, and global liquidity conditions.
| Strait of Hormuz Metric | Value | Global Impact |
|---|---|---|
| Daily Oil Flow | ~15 million barrels/day | 34% of global crude trade |
| Total Petroleum Impact | 20% of global consumption | Closure = instant supply crisis |
| Top Recipient | China (37.7% of flow) | Asian economies most exposed |
| LNG Transit | 83% to Asian markets | Energy security at stake |
| Oil Price Impact (2026) | $65 → $110+/barrel | 70%+ price surge during closure |
The logic is simple: when oil prices spike, inflation rises. When inflation rises, the Federal Reserve can’t cut rates. When rates stay high, liquidity contracts. When liquidity contracts, risk assets including Bitcoin get crushed. Reverse every step of that chain, and you understand why a ceasefire is the single most important catalyst for Bitcoin reaching $100,000.
The Two-Week Ceasefire: What Happened and What’s Next
On April 7, 2026, after threatening to destroy Iran’s power plants and civilian infrastructure, President Trump agreed to a two-week suspension of hostilities. The conditions were specific: Iran must immediately reopen the Strait of Hormuz to all commercial shipping traffic. Pakistan’s Prime Minister Shehbaz Sharif and Field Marshal Asim Munir brokered the deal after Iran rejected an earlier 45-day ceasefire proposed by Egyptian, Pakistani, and Turkish mediators.
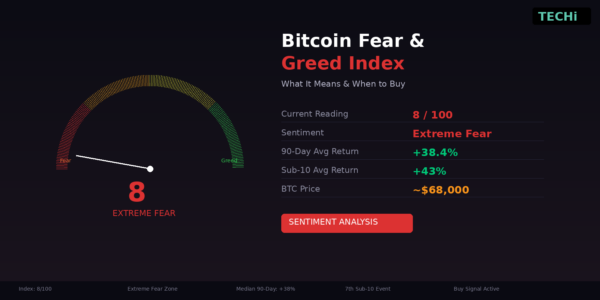
Bitcoin’s reaction tells you everything about the market’s state. When ceasefire rumors first broke on April 6, BTC surged 3% to $69,509, triggering over $270 million in short liquidations. When Trump extended his deadline, BTC fell back below $68,000. The market is coiled, waiting for resolution. It will move explosively in whichever direction the talks go.
The two-week window is critical. If Iran reopens the Strait of Hormuz and negotiations progress toward a permanent deal, the relief trade across all risk assets will be enormous. Crude oil would likely retreat from $110+ toward $75-80. Inflation expectations would drop. The Fed would have cover to signal rate cuts. And Bitcoin, compressed by six weeks of geopolitical fear, would decompress violently upward.
The Oil-Bitcoin Connection: How Crude Prices Move Crypto
The relationship between oil and Bitcoin is indirect but powerful. It operates through three channels.
Channel 1: Inflation Expectations. Higher oil prices feed directly into CPI through gasoline, heating, and transportation costs. When CPI stays elevated, the Fed keeps rates higher for longer. Higher rates mean tighter financial conditions, less leverage in the system, and lower prices for risk assets. A return to $75 oil from $110 would remove approximately 0.5-0.8 percentage points from core CPI within 3-6 months.
Channel 2: Mining Economics. Bitcoin mining is energy-intensive. Higher oil prices increase electricity costs for miners, particularly in regions dependent on fossil fuels. This raises the production cost of Bitcoin, which creates a soft floor but also squeezes miner profitability, potentially forcing sales of BTC reserves. Lower oil prices reverse this: miners become more profitable, reduce selling pressure, and the hash rate can expand without margin compression.
Channel 3: Risk Appetite. Geopolitical conflict suppresses the “animal spirits” that drive speculative markets. When the world feels dangerous, capital flows to treasuries, gold, and cash. When tension resolves, that capital rotates back into equities, crypto, and growth assets. The $270 million in short liquidations on a single ceasefire rumor demonstrates how much capital is positioned for the downside. A confirmed deal would squeeze shorts violently.
The Fed Pivot Domino: From Peace to Rate Cuts to $100K
Here’s the chain reaction that takes Bitcoin from $68,000 to $100,000.
Step 1: Ceasefire becomes permanent. Iran reopens Hormuz, shipping normalizes, oil falls from $110+ to $75-80. This happens within days of a deal.
Step 2: Inflation expectations collapse. Oil at $75 removes the biggest inflationary headwind. CPI projections for H2 2026 drop from 4.5% to sub-3%. Bond markets price in multiple rate cuts.
Step 3: The Fed pivots. Jerome Powell’s successor, expected to be more dovish, uses the cover of falling inflation to begin cutting rates. The first 25bp cut could come as early as July 2026. Markets price in 100-150bp of cuts by year-end.
Step 4: Liquidity flood. Rate cuts expand global liquidity. The M2 money supply, which has been contracting, reverses higher. Every previous Bitcoin bull run has coincided with expanding M2. This isn’t correlation; it’s causation. More money in the system means more money chasing finite Bitcoin supply.
Step 5: FOMO cycle begins. Bitcoin breaks $100,000 (psychological level). Media coverage goes parabolic. Retail investors who’ve been sidelined pour in through ETFs. BlackRock’s IBIT, already at $55 billion AUM, doubles. Daily ETF inflows hit $2-3 billion. The supply-demand imbalance goes exponential.
Step 6: $100,000. In a full liquidity expansion with ETF inflows accelerating, post-halving supply scarcity, and geopolitical relief, $100,000 represents approximately a roughly 47% move from current levels. In the 2020-2021 cycle, Bitcoin did 8x from its halving price. A 3x from here would actually be the most modest post-halving cycle in Bitcoin’s history.
The $128 Billion ETF Wall of Money Waiting for a Catalyst
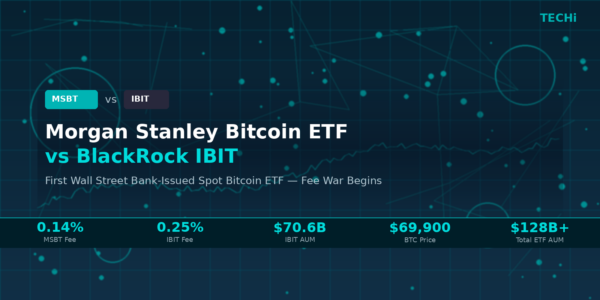
The spot Bitcoin ETF infrastructure is the game-changer that didn’t exist in previous cycles. As of Q1 2026, spot Bitcoin ETFs hold $128 billion in total assets, with BlackRock’s IBIT commanding 45% market share at roughly $55 billion. In Q1 alone, these ETFs attracted $18.7 billion in net inflows despite geopolitical headwinds.
| ETF Metric | Q1 2026 Value | Significance |
|---|---|---|
| Total Spot BTC ETF AUM | $128 billion | Institutional infrastructure for demand |
| IBIT (BlackRock) AUM | ~$55 billion | 45% market share, dominant player |
| Q1 2026 Net Inflows | $18.7 billion | Strong demand despite macro headwinds |
| IBIT Q1 Inflows | $8.4 billion | Leading all spot BTC ETFs |
| BTC on Exchanges | Declining | Supply squeeze intensifying |
Here’s what matters: $18.7 billion flowed into Bitcoin ETFs during a quarter dominated by war fears and $110 oil. Imagine what happens when those headwinds reverse. If a ceasefire triggers a risk-on rotation and Q4 seasonal strength kicks in simultaneously, ETF inflows could double or triple. The ETF structure makes it frictionless for institutional capital to enter Bitcoin. A single allocation decision by a pension fund or sovereign wealth fund can move billions into the market within hours.
The math is stark: if ETF inflows accelerate to $50 billion in Q3-Q4 2026 (plausible in a risk-on environment), and exchange-held Bitcoin continues declining, the price impact would be dramatic. Every dollar of ETF inflow removes real Bitcoin from circulation. At current prices, $50 billion buys approximately 735,000 BTC, or about 3.5% of total supply.
Post-Halving Supply Shock Meets Demand Explosion
The April 2024 halving cut Bitcoin’s new supply issuance from 900 BTC/day to 450 BTC/day. That’s $30.6 million in daily new supply at current prices. When daily ETF inflows exceed $30.6 million (which they do on most days), ETFs are absorbing more Bitcoin than miners produce. The deficit has to come from somewhere: existing holders selling.
But existing holders aren’t selling. Long-term holder supply (coins held for 155+ days) has been increasing throughout 2025 and 2026. The “diamond hands” narrative isn’t just memes; it’s measurable on-chain data showing that experienced Bitcoin holders are accumulating and refusing to sell at current prices.
This sets up the classic supply shock scenario: declining new issuance (halving), declining exchange supply (withdrawals), increasing long-term holder supply (accumulation), and increasing demand pressure (ETFs). Add a geopolitical catalyst that triggers a risk-on rotation, and the supply-demand imbalance could produce the most explosive price move in Bitcoin’s post-ETF era.
The Path to $100K: Three Scenarios
Bull Case: $100,000+ by Q4 2026
Iran ceasefire becomes permanent by May. Oil returns to $75. Fed cuts rates starting July. ETF inflows accelerate to $50B+ in H2. Post-halving supply shock meets liquidity expansion. Bitcoin breaks $85K by June, $95K by August, $100K by October. This requires everything going right simultaneously, but the pieces are all on the board.
Base Case: $85,000-$95,000 by year-end. Ceasefire holds but permanent peace takes longer. Oil settles at $85-90. Fed cuts once or twice. ETF inflows remain steady at $20-30 billion per quarter. Post-halving dynamics drive gradual appreciation. This aligns with consensus analyst predictions from Fundstrat ($150K), CoinShares ($120-170K), and other institutional forecasters.
Bear Case: $50,000-$65,000. Ceasefire collapses. Iran conflict escalates. Oil surges past $130. Fed is forced to hike rates. Global recession fears spike. ETF outflows accelerate. In this scenario, Bitcoin’s cyclical peak may have already occurred, and we enter the bear phase of the halving cycle. The $50,000 level represents strong historical support from the 2021 cycle.
What Could Go Wrong
The Bear Case Is Real: Don’t Ignore These Risks
Ceasefire negotiations have failed before. Trump has given Iran three deadlines and extended all three. Polymarket odds of a permanent ceasefire this month sit at roughly 30%. If talks collapse and the conflict escalates, oil could breach $130, inflation could spike to 6%+, and Bitcoin could retest $50,000. The bull thesis requires peace. Without it, the dominoes fall in the wrong direction.
Escalation Risk: Trump’s rhetoric has been extreme, threatening to destroy infrastructure and warning that “a whole civilization will die.” If negotiations break down, the U.S. could launch strikes that provoke Iranian retaliation, potentially closing the Strait of Hormuz entirely. This would be catastrophic for all risk assets.
Fed Surprise: Even if oil falls, the Fed could maintain a hawkish stance. Sticky core inflation, a strong labor market, or political pressure could delay rate cuts. Without rate cuts, the liquidity expansion needed for $100K becomes unlikely.
Regulatory Risk: Crypto regulation remains a wildcard. While the Clarity Act is progressing, unexpected regulatory action could spook institutional investors and slow ETF inflows. The SEC chair’s approach to crypto enforcement matters more than most analysts admit.
Cycle Exhaustion: Some analysts argue that Bitcoin’s cycle has structurally changed. With institutional maturation, cycles may be flatter with lower peaks and higher floors. A $100K price would represent a 3x from current levels, historically modest for post-halving peaks but potentially ambitious in a more mature market.
The bottom line: $100,000 Bitcoin is achievable, not inevitable. It requires a specific sequence of events: peace in the Middle East, falling oil, Fed rate cuts, and accelerating ETF demand. The Iran ceasefire is the first domino. If it falls, the rest become probable. If it doesn’t, the thesis breaks.
Frequently Asked Questions
Investment Disclaimer
This article is educational and informational only. It is not investment advice. Bitcoin is an extremely volatile asset that can lose 50% or more of its value in a short period. Geopolitical events are inherently unpredictable, and ceasefire negotiations may succeed or fail. Price predictions are speculative and based on historical patterns that may not repeat. Before investing in Bitcoin, cryptocurrency, or any financial asset, consult with a licensed financial advisor who understands your personal situation, risk tolerance, and financial goals. All investments carry risk, including potential loss of principal. The statements about oil prices, Federal Reserve policy, and Bitcoin price targets are based on publicly available information and analysis as of April 8, 2026, and may change.