
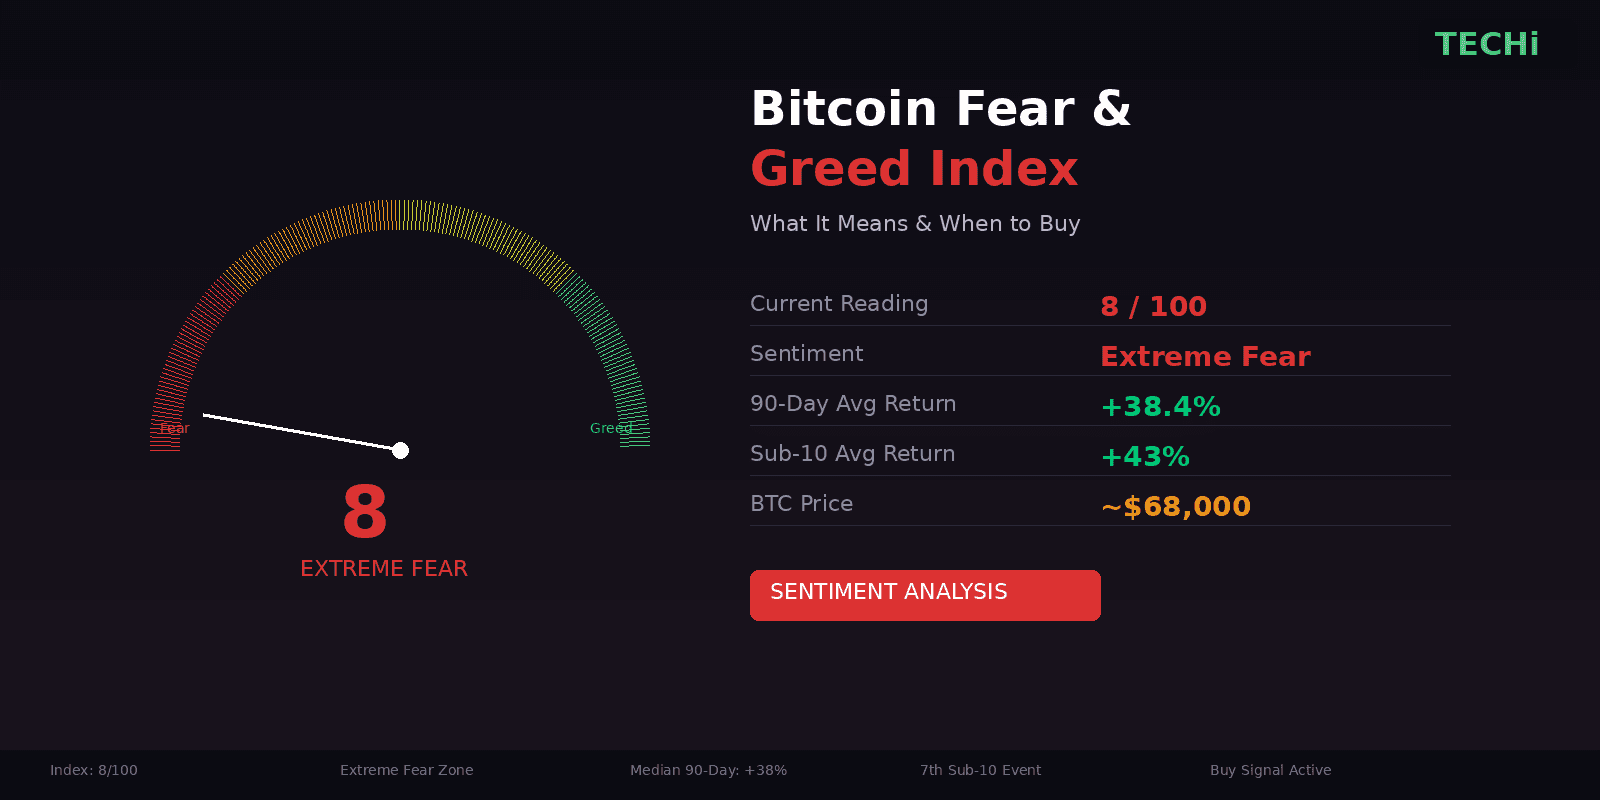
The Bitcoin Fear and Greed Index printed 8 out of 100 on April 1, then 9 on April 3. In the 61 days through April 7 it spent 59 in "Extreme Fear" (25 or below), 26 of them at 10 or under, more than in any earlier 61-day stretch; the previous high was 18, during the Terra and Celsius collapse in mid-2022. On February 12 and again on February 23 it read 5, matching the all-time low first recorded on August 22, 2019.
Readings this low get sold as a buy signal, usually with a table showing every past sub-10 print followed by a fat return. The real record is messier. Extreme fear has preceded some of Bitcoin's best entries and several of its worst. What follows is how the number is built, what is pushing it down, and what the actual history says, with the numbers taken straight from Alternative.me and daily Bitcoin closes.
What the Bitcoin Fear and Greed Index measures
Alternative.me launched the index in February 2018 as a single daily score from 0 (maximum fear) to 100 (maximum greed). It is updated once a day, around midnight UTC, and is republished by many crypto dashboards and data sites; CoinMarketCap runs a separate index built on its own method. The classification bands are Extreme Fear (0-25), Fear (26-46), Neutral (47-54), Greed (55-75) and Extreme Greed (76-100).
The idea is contrarian: when a crowd is panicking it has usually already sold, so panic tends to show up near local lows; when the crowd is euphoric it has usually already bought. That is a tendency, not a law, and the index's own publisher says as much on the page.
How the score is built
Alternative.me lists six inputs and their weights. Only five are live.
Volatility (25%): current volatility and maximum drawdown compared with the 30-day and 90-day averages. An unusual jump in volatility counts as fear.
Market momentum and volume (25%): current volume and momentum against the same 30- and 90-day baselines. Heavy buying volume in a rising market counts as greed; heavy selling counts as fear.
Social media (15%): post counts and interaction rates on Bitcoin hashtags. Alternative.me says its Twitter (X) analysis is running and that its Reddit analysis "is still not in the live index."
Surveys (15%): weekly polls run with Strawpoll. The page marks this component as "currently paused," which means the published weights sum to 85% for the inputs that actually move the number. Alternative.me has not published how the paused weight is redistributed.
Bitcoin dominance (10%): Bitcoin's share of total crypto market capitalisation. Rising dominance reads as money leaving speculative altcoins for Bitcoin, which the model treats as fear.
Google Trends (10%): changes in search volume for Bitcoin-related queries. The publisher's own example of a fear signal is a spike in searches for "bitcoin price manipulation."
Two things follow from the design. First, half the score is pure price-derived data (volatility and volume), so a violent sell-off mechanically drags the index down whatever people are actually saying. Second, the index is backward-looking by construction: it summarises the last few weeks of trading, and it cannot see a ceasefire or an escalation coming.
Why the index has been pinned in single digits
The popular story is that the U.S.-Iran war did this. The dates say the fear came first and the war prolonged it.
The February deleveraging. Bitcoin closed at $95,588 on January 15, down from a closing high of $124,720 on October 6, 2025. On February 5 it lost more than 10% in a day, closing at $62,791, its worst one-day fall since the FTX collapse, with more than $1 billion of leveraged positions liquidated in 24 hours, according to CoinDesk and Bloomberg. Silver and gold sold off the same day and CryptoQuant reported that institutional demand had "reversed materially." The index dropped to 9 on February 6 and hit 5 on February 12.
Then the war. U.S. and Israeli strikes on Iran began on February 28. Iranian forces declared the Strait of Hormuz closed in the first week of March, and Brent crude crossed $100 a barrel on March 8 for the first time since 2022, at one point topping $119, per the Congressional Research Service and Al Jazeera. The EIA puts the strait's 2022 flow at about 21% of global petroleum liquids consumption. Bitcoin, which had climbed back to a $74,886 close on March 16, gave that up as the conflict escalated. The index, which had briefly reached 28 on March 17, fell back to 8 on March 23 and again on March 30 and April 1.
The deadline. President Trump set 8 p.m. ET on April 7 as Iran's deadline to reopen the strait and threatened to strike Iranian power plants and bridges if it did not, as reported by NBC News and Al Jazeera. Brent was about $111 a barrel on the morning of April 6, per Fortune. About 90 minutes before the deadline, Trump announced a two-week ceasefire brokered by Pakistan, conditional on Iran reopening the strait, and Brent fell about 13% to near $95 that night, per Al Jazeera and CBS News. Bitcoin closed April 6 at $68,854 and April 7 at $71,910, inside the $64,000-$75,000 range it has closed within since the February crash.
Volatility, selling volume, rising Bitcoin dominance and grim social feeds all point the same way, which is why the score sits where it does. It read 11 on April 7, then 17 on April 8 and 14 on April 9 after the ceasefire, still in Extreme Fear.
What actually happened after past sub-10 readings
Alternative.me has published 2,887 daily values before this year. Only 40 of them were 10 or below, clustered into nine separate episodes (readings 30 days or less apart count as one). Here is each episode, measured from Bitcoin's daily close on the day of its lowest reading, with the change in price 30, 90 and 365 calendar days later. Prices are daily closes from Alpha Vantage's BTC/USD series.
- February 6, 2018 (reading 8, BTC $7,769): +21% after 30 days, +21% after 90 days, -56% after a year.
- November 25, 2018 (reading 9, BTC $4,008): -5% after 30 days, +3% after 90 days, +78% after a year. The actual price low came three weeks later, near $3,200.
- August 22, 2019 (reading 5, BTC $10,124): -1% after 30 days, -20% after 90 days, +14% after a year.
- March 14, 2020 (reading 8, BTC $5,213): +31% after 30 days, +81% after 90 days, +1,039% after a year. The COVID crash, and the single episode that makes every "average return" look heroic.
- May 24, 2021 (reading 10, BTC $38,619): -13% after 30 days, +27% after 90 days, -23% after a year.
- January 8, 2022 (reading 10, BTC $41,753): +5% after 30 days, +1% after 90 days, -59% after a year.
- June 18, 2022 (reading 6, BTC $19,008): +18% after 30 days, +4% after 90 days, +39% after a year. Note that this episode's first reading of 10 or below came on May 10 at $31,025; a buyer on that first signal was down 23% after 90 days and still down 11% a year on. A buyer on the May 17 reading of 8, at $30,453, was down 33% a month later.
- February 27, 2025 (reading 10, BTC $84,625): -2% after 30 days, +27% after 90 days, -22% after a year.
- November 15, 2025 (reading 10, BTC $95,545): -10% after 30 days, -28% after 90 days. The one-year mark has not arrived.
- February 12 and 23, 2026 (reading 5, BTC $66,208 and $64,626): +8% and +10% after 30 days. The 90-day mark has not arrived.
What the numbers say
Over 90 days, seven of nine completed episodes were positive, but the median gain was about 4% and the mean about 13%, with two double-digit losses (2019, 2025-26). That is a modest edge with wide dispersion.
Over 12 months, four of eight completed episodes were positive and four were negative. The median one-year outcome is a loss of roughly 4%. The mean is +126%, and every bit of that comes from March 2020; strip it out and the mean is negative. All four losing episodes (February 2018, May 2021, January 2022 and February 2025) were down 22% to 59% a year later.
The pattern is that a reading of 10 or below tells you selling has been violent. It does not tell you whether the selling is finished. In 2018, 2019 and May 2022 the index went single-digit months before the eventual price low; in March 2020 it marked the low almost to the day, and in June 2022 it marked the low of that leg before the FTX collapse took Bitcoin another 17% lower in November. There is no way to know in advance which kind of episode you are in, and this one already has more readings of 10 or below than any before it.
What the reading is useful for
Treated as a description of conditions rather than a forecast, the index earns its place.
As a check on your own reaction. If your instinct to sell is arriving alongside some of the lowest sentiment readings in the index's history, the crowd is on your side of the trade, which is rarely where the edge is. The same applies in reverse when the score is above 75.
As a filter, not a trigger. The episodes that ended well were the ones where the driver of the fear was resolved (a virus response, a bankrupt lender working through the courts). The ones that ended badly were the early innings of a longer bear market. Which side this one lands on depends on things the index cannot measure: whether the two-week ceasefire holds and the strait actually reopens, where oil settles, and whether the forced selling that started in February has run its course.
Alongside data the index ignores. Spot Bitcoin ETFs hold about 1.31 million BTC, worth roughly $90 billion, and took in a net $1.32 billion in March despite the war, their first monthly inflow since October, per CoinDesk. That is a buyer the 2018-2022 index history never had, and a reason to be careful about mapping old episodes onto this one in either direction. Exchange balances, long-term-holder supply and the Bitcoin price technical picture are the other inputs worth checking before acting on a sentiment number.
The limits
Small sample. Nine completed episodes is not a dataset that supports confident probabilities. Treat the percentages above as anecdotes with dates, not as odds.
Half the score is price. Volatility and volume are 50% of the weight, so the index partly restates the drawdown you can already see on the chart.
A paused input. With surveys switched off, the effective weights are not the published ones, and Alternative.me has not documented the rebalancing.
No forecasting content. The index summarises the past few weeks of trading. The two-week ceasefire announced on April 7 lifted it only from 11 to 17 the next day, and a breakdown of the truce could push it back toward 5. Whether the truce holds is not in the number.
Bitcoin is a volatile asset and can fall further from any level, including this one. Nothing here is a recommendation to buy or sell; what and whether to buy depends on your own circumstances and risk tolerance. What the record does support is narrower: readings this low have marked both generational entries and the start of long declines, and the split between the two is close to even.
FAQ
Frequently asked questions
What is a good Fear and Greed Index score to buy Bitcoin?
There is no score that has reliably marked a bottom. Readings of 10 or below have been followed by a positive 90-day return in seven of nine completed cases, but the median gain was only about 4%, and a year later the record is four wins and four losses. Extreme fear is a signal that selling has been severe, not that it is over.
Did the index really hit 8 in April 2026?
Yes. Alternative.me published 8 on April 1 and 9 on April 3, following 8 on March 23 and March 30. The low of 5 was first recorded on August 22, 2019 and matched on February 12 and February 23, 2026; the index read 11 on April 7, 17 on April 8 and 14 on April 9.
How often is the Bitcoin Fear and Greed Index updated?
Once a day, around midnight UTC. The published weights are volatility 25%, market momentum and volume 25%, social media 15%, surveys 15% (paused), Bitcoin dominance 10% and Google Trends 10%.
Why is the index so low in early April 2026?
Bitcoin fell from a $95,588 close on January 15 to $62,791 on February 5 in a leverage-driven sell-off, and the index went single-digit the next day. The U.S. and Israeli war with Iran that began on February 28, Iran's closure of the Strait of Hormuz and Brent crude above $100 kept volatility and selling pressure high through March. The two-week ceasefire announced on April 7 lifted the index only to 17 on April 8 and 14 on April 9.
Is this the same as CNN's Fear and Greed Index?
No. CNN's index measures U.S. stock-market sentiment from inputs such as the VIX, market breadth and demand for safe-haven bonds. Alternative.me's crypto index uses Bitcoin volatility, volume, social media, dominance and search trends, so the two gauge different markets.
Should I sell Bitcoin when the index shows Extreme Greed?
Not on the reading alone. The index stayed above 75 for 76 straight days from November 6, 2020, while Bitcoin kept climbing, so Extreme Greed describes a euphoric crowd; like extreme fear, it does not time the turn.

Disclaimer
This article is for informational purposes only and does not constitute financial, investment, tax, or legal advice. Market data, tax rules, and prices can change after the article date. TECHi and its authors may hold positions in securities or digital assets mentioned. Always conduct your own research and consult a licensed financial, tax, or legal professional before making decisions.





Comments