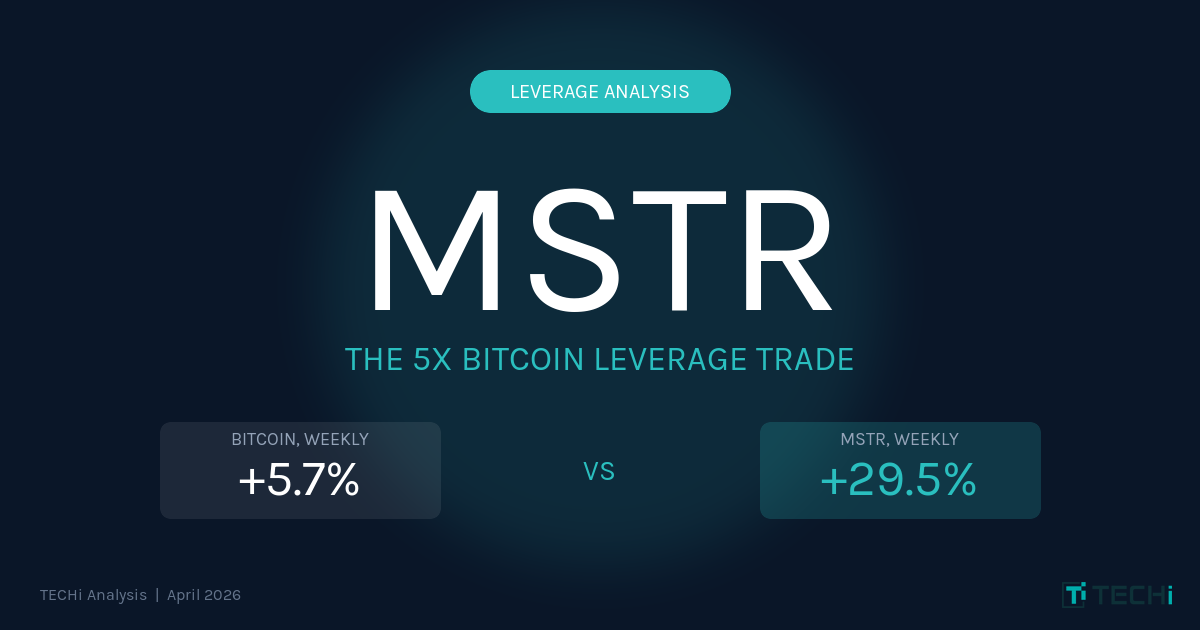
- MSTR Outran BTC 5-to-1MSTR closed at $166.52 on April 17, up 29.5% week-over-week. Bitcoin moved 5.7% over the same window, implying a realized weekly beta near 5.2x — the highest in 90 days.
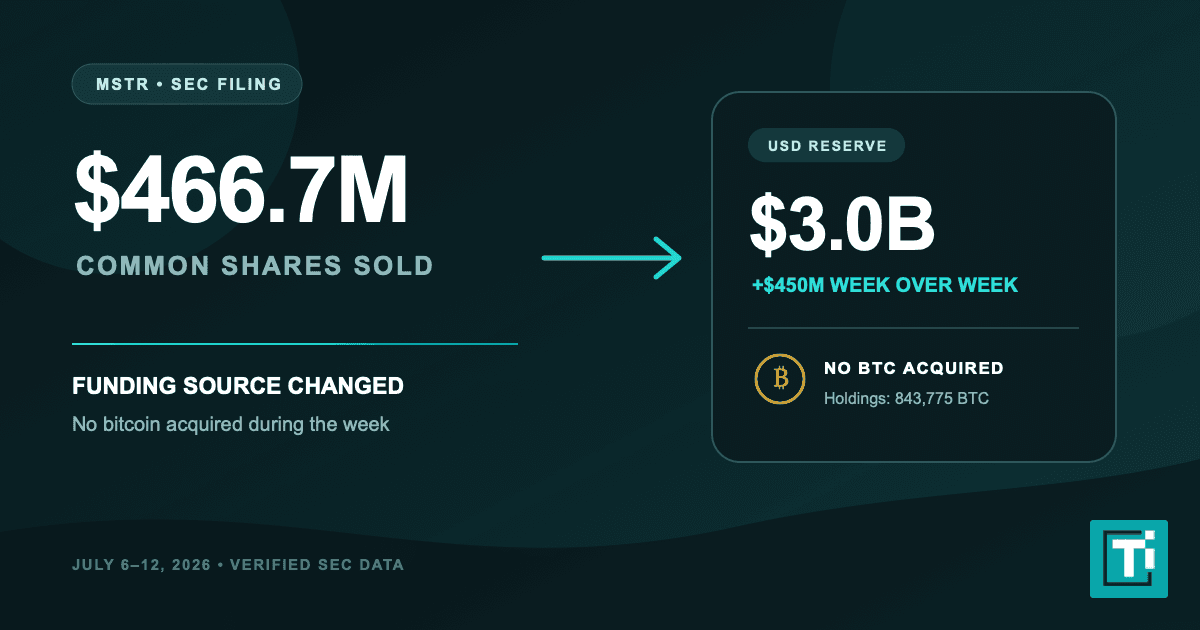
- 780,897 Bitcoin on BalancePer Strategy's April 13, 2026 8-K, the company holds 780,897 BTC acquired at an average of $75,577 per coin for $59.02 billion cumulative — roughly 3.8% of Bitcoin's entire circulating supply.
- mNAV Is the Hidden LeverThe mNAV premium sits near 1.2x today, well below the 2.6x–2.8x late-2024 peak but still a premium over underlying BTC. Premium compression, not just BTC price, drove roughly half of the January drawdown.
- Capital Stack Has $18.5B of Senior Claims$8.25B convertible debt plus ~$10.3B preferred stock (STRK, STRF, STRD, STRC at 8–11.5%) sit ahead of common equity. Annual preferred dividends approach $1 billion; software operations used $21.6M in cash during 2025.
- The Math Works Both WaysDuring Jan–Feb 2026, BTC fell 36% and MSTR fell 44% — leverage amplified the downside. A 5x beta is not a feature of the bull case only; investors must own the symmetric bear case.
Strategy (NASDAQ: MSTR), the company formerly known as MicroStrategy, closed last Friday at $166.52, up roughly 29.5% from the prior Friday's $128.64. Bitcoin, over the same seven sessions, rallied from $72,980 to $77,140, about 5.7% on a close-to-close basis, and peaked near $78,390 intraday for a 7.4% high-water weekly move. Whichever reference point you prefer, MSTR outran spot Bitcoin by roughly five to one.
That ratio is not an accident. It is the explicit design of the most aggressive corporate Bitcoin trade on public markets, and the same mechanics that turbocharge the upside turn punishing when Bitcoin rolls over. What follows is a data-driven walk through exactly how MSTR's leverage is engineered, what the current capital stack looks like after Strategy's latest $1 billion BTC purchase, and why the same investors celebrating a 29% week need to be honest about what a symmetric move on the downside would actually do to the share price.
The Week That Proved the Leverage Thesis
On Friday, April 17, MSTR printed an intraday high of $173.15 on volume of 52.17 million shares — more than double the stock's three-month average turnover. The session opened at $154.63 and closed at $166.52, stamping a weekly candle that dwarfed the underlying asset it tracks. Bitcoin's own weekly candle was constructive, not explosive: a 5.70% close-to-close gain with a brief test above $78,000 before settling.
Converting those two numbers into a beta estimate tells the story. A 29.45% MSTR move against a 5.70% BTC move implies a realized weekly beta of roughly 5.2. Against the 7.4% high-tick, it compresses to around 4.0. Either way, the stock behaved during this rally like four-to-five times leveraged Bitcoin exposure without the funding cost of a prime-brokerage margin loan and without the liquidation cascade risk of a perpetual futures position. That is the precise product Strategy has spent six years engineering.
MetricMSTRBitcoin (X:BTCUSD)Close, Friday Apr 10, 2026$128.64$72,980.69Close, Friday Apr 17, 2026$166.52$77,140.83Weekly return (close-to-close)+29.45%+5.70%Weekly high / low$173.15 / $126.05$78,390 / $72,260Realized weekly beta vs BTC~5.2x (close-to-close); ~4.0x (intraday high)
Why MSTR Trades Like Five-Times Leveraged Bitcoin
Strategy published an 8-K on April 13, 2026 confirming the treasury crossed a number that still takes a moment to absorb: 780,897 bitcoin on the balance sheet, acquired for a cumulative $59.02 billion at an average price of $75,577 per coin. At Bitcoin's Friday close of $77,140, that stack is worth approximately $60.2 billion, marginally above cost basis. That equates to roughly 3.9% of Bitcoin's approximately 20.0 million circulating supply sitting inside one Nasdaq-listed corporate entity, a concentration that dwarfs every other public corporate holder of Bitcoin including Tesla, Block, and Metaplanet combined.
The mechanism that converts BTC exposure into amplified equity returns is called mNAV, a multiple of net asset value that measures how much investors are willing to pay for a dollar of Strategy's Bitcoin through the MSTR wrapper. At a share price of $166.52 and approximately 338.6 million shares outstanding as of the company's March 20, 2026 disclosure, MSTR's common equity carries a market capitalization near $56.4 billion. Layer on $8.25 billion of convertible notes and roughly $10.3 billion of preferred stock across the STRK, STRF, STRD, and STRC series, and enterprise value climbs toward $74 billion. Divided by the $60.2 billion Bitcoin NAV, current mNAV sits near 1.23x, consistent with the 1.20x reading VanEck reported on March 1, 2026. That is meaningful compression from the 2.6x–2.8x peak in late 2024, but it still means investors are paying roughly $1.23 of equity value for each $1 of underlying Bitcoin.
That premium is not irrational on its face. Saylor's stated strategy is to issue equity and convertible debt whenever the mNAV premium is above 1.0x, use the proceeds to buy more Bitcoin, and increase Bitcoin-per-share for existing holders (a metric the company reports as "BTC Yield," running 5.6% year-to-date through mid-April). When the premium is above 1.0x, every dollar raised at the stock's premium valuation buys more than a dollar of Bitcoin at market, accreting BTC-per-share. When the premium falls toward 1.0x or breaks below it, as happened briefly in November 2025 when MSTR touched 0.97x for the first time since January 2024, issuance becomes dilutive and management typically pauses the ATM. The premium itself, in other words, is the fuel.
Readers who want the full backstory on how Strategy moved from a sleepy business-intelligence software vendor into the largest corporate Bitcoin holder in history can read our complete history of MicroStrategy and Michael Saylor's Bitcoin bet. The mechanics below focus specifically on why the share price is this reactive, and what has to be true for the trade to keep working.
The Bull Case: When Leverage Works For You
The bull thesis on MSTR rests on three reinforcing levers. First, direct BTC exposure: every 10% move in Bitcoin contributes roughly $6 billion to the mark-to-market value of the treasury, which flows directly into book equity under the fair-value accounting standard (ASU 2023-08) Strategy adopted at the start of 2025. Second, the convertible call option: the $8.25 billion in outstanding convertible notes gives bondholders the right to convert into equity at strikes ranging from roughly $149.80 to $672.40 per share. As MSTR rallies toward higher strikes, implied volatility on the stock spikes (which is why MSTR options are among the highest-vol single-name equities on US markets), and the convertible arb bid reinforces the rally. Third, the issuance flywheel: at premiums above 1.0x mNAV, every dollar of equity raised accretes BTC-per-share and tightens the supply/demand on MSTR common.
Saylor is leaning into all three. Strategy's most recent $1 billion purchase closed on April 13, adding 13,927 BTC at an average price of $71,902, funded through a combination of ATM equity issuance and STRC non-dilutive preferred proceeds that bypass common-share dilution entirely. Analysts tracking the cadence project the company could cross the symbolic 1,000,000 BTC threshold as early as November 2026 if current accumulation rates hold and Bitcoin does not rally meaningfully higher (a higher price would slow the pace because Saylor has publicly stated the company will prioritize BTC-per-share growth over headline coin count).
There is also the macro tailwind. If the bull scenarios in our Bitcoin price prediction model play out and BTC pushes back above $100,000, the math on MSTR becomes even more aggressive. A hypothetical BTC move from $77,000 to $120,000, a 56% gain, applied at a cycle beta closer to the 2.5x–3.0x historical average (the recent 5x is a short-window print, not a sustainable multiplier) would imply an MSTR print somewhere between $395 and $445. That is not a forecast; it is arithmetic. The whole point of the wrapper is that the arithmetic does not care about your direction of conviction.
The Bear Case: When Leverage Works Against You
This is the part that matters, and it is the part most MSTR fan accounts on X will not write. Leverage is symmetric. A stock that does 5x Bitcoin on the way up does 5x Bitcoin on the way down. The evidence is already on the tape; investors simply chose to stop looking at it the moment the chart turned green.
Between mid-January 2026 and early February 2026, MSTR fell from a January 22 intraday high of $190.20 (close: $179.33) to a February 3 intraday low of $104.17 (close: $106.99), a 45.2% peak-to-trough drawdown in roughly two weeks. Bitcoin over the same window fell from approximately $96,955 to $62,181, a 35.9% drawdown. MSTR fell harder than Bitcoin, and it fell harder for three specific reasons that are still structurally present today.
First, mNAV compression. During the January sell-off the premium collapsed from roughly 1.9x to a trough near 0.95x. Even if Bitcoin had been flat, that multiple compression alone would have erased nearly 50% of MSTR's market value. Bitcoin was not flat; it fell 36%, so shareholders absorbed both the spot decline and the premium contraction simultaneously. The current ~1.2x mNAV is already well off its 2.6x–2.8x late-2024 peak, and the path to get here was not linear: on November 12, 2025, the multiple briefly broke below 1.0x to 0.97x, the first sub-NAV print for MSTR since January 2024. If sentiment sours further, the multiple can compress back toward that 0.97x floor or below, amplifying any BTC weakness into double-digit additional equity losses.
Second, fixed obligations on a volatile asset. Strategy now carries $8.25 billion of convertible debt and approximately $10.3 billion of preferred stock across four series paying cash dividends between 8% (STRK) and 11.5% (STRC). The preferred stack alone generates a cash-dividend obligation approaching $1 billion annually, and the software business, which used roughly $21.6 million in operating cash during 2025, gets nowhere near covering it. The shortfall is financed by issuing more equity or preferred stock. If the stock falls far enough to close the ATM window (i.e., mNAV drops below a level where issuance is accretive), the company has to either draw down cash reserves, sell Bitcoin, or restructure the preferred. Selling Bitcoin during a drawdown is the one action Saylor has publicly vowed never to take. That vow is a commitment, not a guarantee.
Third, convertible-bond reflexivity works both ways. The same volatility bid that rockets MSTR higher in bull phases becomes a short hedge during sell-offs: convertible arb desks that own the bonds and are short the stock as a delta hedge will sell MSTR stock into weakness as the delta collapses. It is a known feature of convertible-heavy capital stacks and it contributed materially to the January-February drawdown that a lot of the current bull commentary now tends to forget.
Put concretely: the same 5x beta that makes a 6% Bitcoin week into a 30% MSTR week would make a 20% Bitcoin correction into a 90%+ MSTR loss at worst-case premium compression. We have year-to-date evidence on the tape: Bitcoin is down 12.7% YTD through April 17 (from $88,397 on December 30 to $77,141), and MSTR, even after last week's rally, is only up about 7.0% YTD. The apparent divergence masks the fact that MSTR was sitting at a 45% drawdown in early February while Bitcoin was "only" 36% lower. The stock that outruns Bitcoin on the way up also overshoots on the way down, and the window between the two is where conviction gets tested.
For a real-world illustration of how brutally this math can compound against a Bitcoin treasury company when the premium collapses, Japan's Metaplanet provides the current case study. That stock sits in a prolonged bear phase even as Bitcoin has rallied, purely because the mNAV premium that once drove the stock to 8x NAV has compressed toward 1.3x. MSTR is not Metaplanet (the capital structure, liquidity, and scale are categorically different), but the warning is identical.
MSTR vs a Spot Bitcoin ETF: Picking the Right Exposure
For investors whose thesis is simply "I want Bitcoin exposure in a brokerage account," the spot ETFs (IBIT, FBTC, BITB, ARKB) deliver that exposure at fee loads of 0.12% to 0.25% with minimal tracking error to Bitcoin's spot price. They are the dominant vehicle for a reason: simplicity, tax transparency, and direct 1:1 exposure to the live Bitcoin price you can verify on our live Bitcoin price tracker.
MSTR is a different product. It is an actively managed, leveraged Bitcoin accumulation vehicle with permanent capital (via the preferred stack), balance-sheet optionality, and the mNAV premium as an independent return driver. Investors who choose MSTR over IBIT are implicitly betting on three things simultaneously: (1) Bitcoin itself rallies, (2) Saylor keeps executing the issuance flywheel without major missteps, and (3) the market continues to assign a premium multiple to the wrapper. Those three bets pay off together in bull markets and punish together in bear markets. That is the distinction that matters, and it is why position sizing in MSTR should reflect a higher-volatility product, not a pure Bitcoin proxy.
The Numbers at a Glance
Data PointValue (as of April 17, 2026)MSTR last close$166.52MSTR weekly return+29.45%MSTR year-to-date return+7.0%Bitcoin last close (Massive)$77,140.83Bitcoin weekly return+5.70%Bitcoin year-to-date return-12.7%Strategy Bitcoin treasury780,897 BTCAverage purchase price$75,577 per BTCCumulative BTC cost basis$59.02 billionTreasury value at Friday close~$60.24 billionConvertible debt outstanding$8.25 billionPreferred stock outstanding~$10.3 billion (STRK, STRF, STRD, STRC)BTC Yield YTD 20265.6%Current mNAV multiple~1.2x (1.20x VanEck, Mar 1, 2026)Share of Bitcoin supply held3.9% (780,897 / 20.01M)
FAQ
Frequently asked questions
Is MSTR really five-times leveraged Bitcoin?
Not contractually. There is no futures contract or margin loan creating a mechanical 5x. The realized 5.2x weekly beta through the April 10–17 window is a product of three factors stacking: (1) direct BTC exposure on $60 billion of treasury holdings, (2) the mNAV premium expansion that lets equity outpace NAV growth, and (3) convertible-bond reflexivity that amplifies volatility. The ratio is not constant; it can compress to 2x in quiet markets and expand above 6x during premium-re-rating phases. Historically the trailing 90-day beta of MSTR to BTC has ranged from roughly 1.8x to 3.5x, with weekly prints well above that during extreme moves.
How much Bitcoin does Strategy actually own?
Per the 8-K filed April 13, 2026, Strategy holds 780,897 bitcoin acquired for $59.02 billion at an average price of $75,577 per coin. That is approximately 3.9% of Bitcoin's circulating supply and makes Strategy the largest corporate Bitcoin holder in history, larger than the next five public holders combined. Saylor has publicly targeted the 1 million BTC milestone by year-end 2026, which would require roughly another $17 billion of BTC purchases at current prices.
What is mNAV and why does it matter?
mNAV stands for multiple of net asset value. It is calculated as MSTR's enterprise value (common market cap + debt + preferred stock, minus cash) divided by the market value of the Bitcoin treasury. A reading above 1.0x means investors pay more than $1 of equity value for each $1 of underlying Bitcoin. The premium has ranged from 0.97x (the November 12, 2025 sub-NAV trough) to 2.8x (peak enthusiasm in late 2024). As of Friday's close, mNAV is approximately 1.2x, consistent with the 1.20x reading VanEck published on March 1, 2026. The premium itself is a material component of MSTR returns: half of the stock's 2024 performance came from multiple expansion, not Bitcoin price appreciation.
What happens if Bitcoin falls 30%?
Mechanical estimate at the recent 5x realized weekly beta: a 30% Bitcoin decline would imply an MSTR decline north of 80% in a worst-case premium compression scenario. History provides a less extreme but still sobering reference. During the January–February 2026 drawdown, Bitcoin fell 36% and MSTR fell 45% peak-to-trough. The premium compressed from 1.9x to 0.95x, which alone removed half of the equity value. The bull case and the bear case use the same arithmetic; investors who want MSTR's upside must be willing to own the downside version of the same equation.
MSTR versus IBIT or FBTC — which is the better Bitcoin play?
They are different instruments. Spot Bitcoin ETFs like BlackRock's IBIT and Fidelity's FBTC deliver clean 1:1 exposure to spot Bitcoin at fee loads of 0.12%–0.25% with minimal tracking error. MSTR delivers leveraged, actively managed exposure with mNAV as an independent return driver, plus additional dilution and credit risk from the preferred/convertible capital stack. The ETFs are the right choice for investors who want Bitcoin exposure as a portfolio allocation. MSTR is the right choice for investors who want a higher-beta bet on Bitcoin with full understanding of the amplified downside. Position sizing should reflect the volatility differential; MSTR's 90-day implied volatility has routinely run 2x to 3x that of Bitcoin itself.
Can Strategy be forced to sell Bitcoin to pay its debts?
Not imminently, but the risk is non-zero and under-discussed. The convertible notes have maturities stretched through 2032 and are mostly covered by Bitcoin collateral value at current prices. The preferred stock dividends (approaching $1 billion annually across all four series) dwarf the software business's free cash flow and are currently funded by issuing more equity or preferred — a system that works only while mNAV supports non-dilutive issuance. In a prolonged Bitcoin bear market with mNAV trapped below 1.0x, Saylor's options narrow to: sell a small portion of BTC, draw down cash, restructure preferred, or let the preferred stack accumulate unpaid dividends. None of these are catastrophic, but all of them are dilutive to common shareholders to some degree.
Disclaimer
This article is for informational purposes only and does not constitute financial, investment, tax, or legal advice. Market data, tax rules, and prices can change after the article date. TECHi and its authors may hold positions in securities or digital assets mentioned. Always conduct your own research and consult a licensed financial, tax, or legal professional before making decisions.
About the Author

Omer Sheikh covers Elon Musk-led and Musk-adjacent companies for TECHi, with a focus on Tesla, xAI, SpaceX, X, Neuralink, The Boring Company, and the public-market read-throughs from their product cycles, capital needs, AI infrastructure plans, supply chains, and regulatory risk. He also follows MicroStrategy/Strategy and its Bitcoin treasury strategy, using his finance background to connect balance-sheet decisions, capital markets, valuation, catalysts, and downside risk. His work is built for readers who want the investment case behind the headline: what changed, what it means for cash flow or market value, and what would prove the thesis wrong.