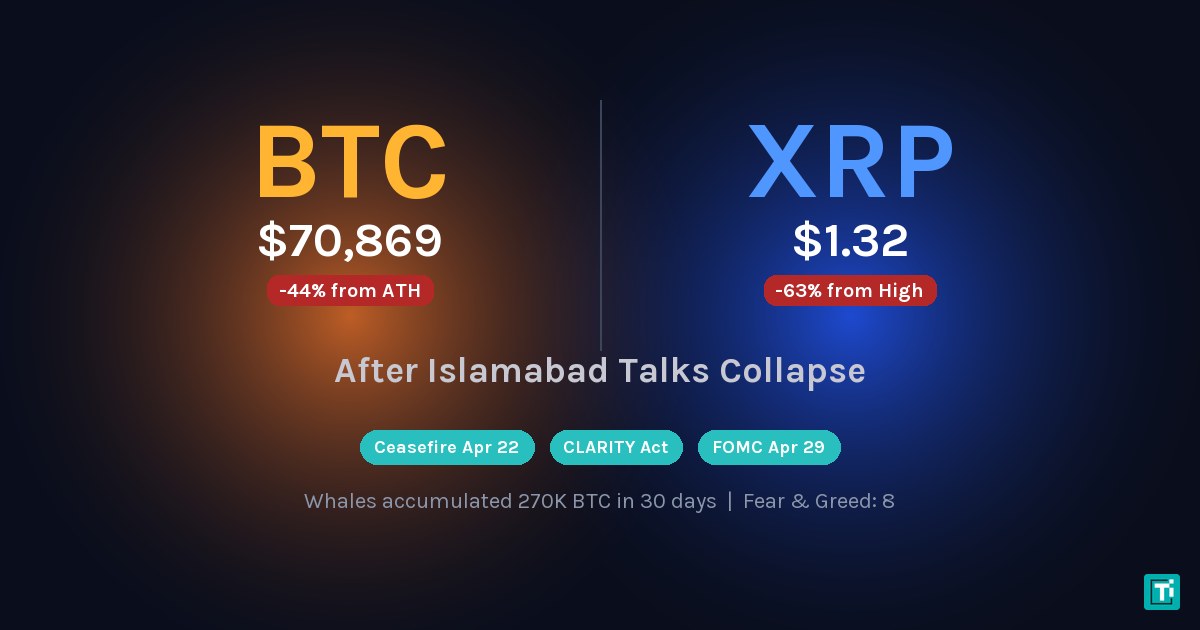
Pakistan-India bilateral talks collapsed Friday afternoon in Islamabad. Bitcoin dropped $4,200 in three hours. XRP shed 8.3% in a single session. And while retail traders hit the sell button, blockchain data from CryptoQuant reveals that whale wallets holding more than 1,000 BTC accumulated roughly 270,000 coins over the past 30 days, the largest sustained buying spree since early 2013.
That disconnect between price action and on-chain behavior sets up what could be the most decisive three-week stretch of 2026 for digital assets. Three major catalysts arrive between April 22 and April 29, and how each resolves will likely determine whether Bitcoin retests $80,000 or breaks below $65,000.
Key Takeaways
- Bitcoin dropped to $70,800 after Islamabad bilateral talks collapsed on April 11, its largest single-day decline since the March 2026 tariff shock, while weekend trading pushed it slightly higher to $70,869.
- Whale wallets accumulated 270,000 BTC worth $19.1 billion over the past 30 days, the largest sustained buying spree since 2013, as exchange reserves hit their lowest since December 2017 at 2.21 million BTC.
- Three catalysts arrive by April 29 including the Pakistan-India ceasefire expiration (April 22), the CLARITY Act Senate markup (this week), and the FOMC rate decision (April 28-29).
- XRP fell 8.3% to $1.32 sitting 63% below its $3.65 cycle high, with Standard Chartered slashing its target from $8.00 to $2.80 on geopolitical headwinds and regulatory delays.
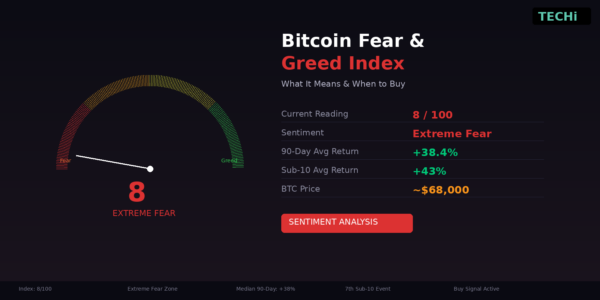
- Fear & Greed Index at 8-12 for 46 days matching conditions that preceded 74% to 1,060% Bitcoin gains within 12 months during the three prior extreme fear periods of similar duration.
Last updated: April 13, 2026 at 2:45 PM ET
What the Islamabad Collapse Means for Crypto Markets
Indian Foreign Secretary Vikram Misri walked out of emergency bilateral talks on Friday, citing irreconcilable positions on Siachen withdrawal timelines. The 72-hour ceasefire triggered after the Kashmir Line of Control incursion technically holds until April 22, but diplomatic sources told Reuters that neither side expects an extension.
Global risk assets sold off immediately. The S&P 500 dropped 1.4%. Gold surged above $3,240. Bitcoin fell from roughly $74,900 to $70,800, its largest single-day decline since the March 2026 tariff shock. XRP took a harder hit on a percentage basis, falling from $1.44 to $1.32 and pushing the token 63% below its December 2025 cycle high of $3.65.
The selloff hit XRP disproportionately hard because the token carries higher beta to geopolitical risk. When Congress pivots attention toward foreign policy crises, domestic crypto legislation stalls. That dynamic directly threatens the regulatory clarity XRP needs to re-rate higher.
Bitcoin closed Friday at $70,767 according to Polygon.io market data, with weekend trading pushing the price marginally higher to approximately $70,869.
On-Chain Data Tells a Completely Different Story
The headline numbers look dire. Beneath the surface, the data points in a starkly different direction.
Bitcoin exchange reserves fell to 2.21 million BTC last week, the lowest level since December 2017. When coins leave exchanges, it typically signals long-term holding intent rather than imminent selling pressure. Exchanges lost 48,000 BTC in the seven days ending April 12, an acceleration of the drawdown trend that began in January.
Whale wallets (those holding 1,000+ BTC) added approximately 270,000 BTC over the past 30 days. At current prices, that represents roughly $19.1 billion in accumulation. The last time whale buying hit this magnitude was early 2013, when Bitcoin traded below $100.
The Crypto Fear & Greed Index has spent 46 consecutive days in “Extreme Fear” territory, reading between 8 and 12. Wednesday’s brief ceasefire rally liquidated $427 million in short positions, revealing how dangerously leveraged the bearish trade has become.
This pattern of declining exchange reserves plus whale accumulation during extreme fear periods has appeared three times previously: March 2020, June 2022, and November 2022. In each case, Bitcoin traded meaningfully higher 12 months later.
Bitcoin miners have also slowed their selling. Post-halving economics forced inefficient miners offline throughout late 2025, and the survivors now hold approximately 1.82 million BTC in aggregate reserves. Hash rate hit a new all-time high of 847 EH/s last week despite the price decline, signaling that remaining miners are profitable enough to weather volatility rather than liquidate inventory.
The combined picture from exchange flows, whale wallets, and miner behavior suggests that selling pressure is concentrated among retail and short-term holders while long-term conviction capital continues accumulating.
The Three-Week Gauntlet: April 13 to May 1
Three catalysts between now and month-end will likely determine the direction for both BTC and XRP through the summer. Each one carries enough weight to move prices 10% or more on its own.
Catalyst 1: Ceasefire Expiration (April 22)
The Pakistan-India ceasefire expires in nine days. An extension calms markets and likely triggers a relief rally similar to Wednesday’s $427 million short squeeze. A collapse risks a broader risk-off cascade that could push Bitcoin below $65,000 and XRP toward $1.00. Defense analysts have warned of renewed hostilities if talks do not resume before the deadline. Regional exchanges also reported heightened stablecoin demand as traders sought dollar-denominated safe havens. These regional dynamics add a layer of demand that global market data does not fully capture.
Catalyst 2: CLARITY Act Markup (Senate Banking Committee)
The Senate Banking Committee returns Monday with the Crypto Lummis-Gillibrand CLARITY Act on its markup calendar. The bill would classify certain digital assets, including XRP, as commodities under CFTC jurisdiction. For Ripple’s ecosystem specifically, commodity classification would resolve the regulatory overhang that persisted through the SEC lawsuit era and open the door to futures, options, and institutional structured products.
Market trackers have reported continued institutional interest in XRP-related products since late 2025, though the pace of fresh inflows appears to have slowed in recent months. A favorable CLARITY vote could reverse that slowdown and reignite institutional demand.
Catalyst 3: FOMC Decision (April 28-29)
CME FedWatch prices a 94.8% probability the Fed holds rates at 4.25-4.50%. The decision itself is largely priced in. What matters is the statement language around inflation expectations, particularly given WTI crude surging above $104 on Hormuz blockade fears. A hawkish tone emphasizing inflation risks pressures crypto alongside other risk assets. Acknowledgment of slowing growth provides a tailwind.
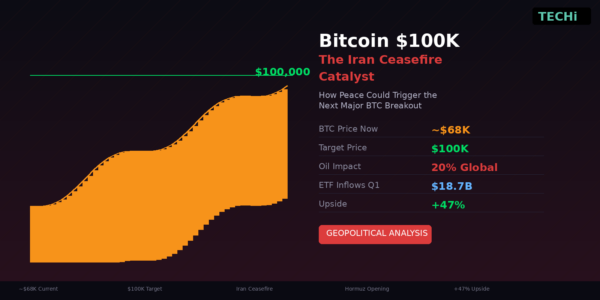
Bitcoin at $70,800: The Case for $100K and the Case for $65K
Bitcoin spot ETFs now hold over $150 billion in assets under management, with $53 billion in cumulative net inflows since their January 2024 launch. Despite the Islamabad selloff, ETF outflows last week totaled only $312 million. Compare that to the $2.1 billion exodus during March’s tariff panic. Institutional conviction appears intact even as prices fall.
Standard Chartered recently revised its 2026 year-end Bitcoin target from $200,000 to $100,000, citing the geopolitical premium now embedded in global risk pricing. Even at that reduced figure, the implied upside from $70,800 exceeds 41%. The bear case hinges on a ceasefire collapse plus hawkish Fed language pushing Bitcoin toward the $62,000-$65,000 support zone established during March’s tariff-driven flush.
The April 2024 halving cut block rewards from 6.25 to 3.125 BTC. Every prior halving cycle produced Bitcoin’s strongest returns in the 12 to 18-month window following the event. April 2026 marks exactly 12 months post-halving, placing the current cycle at the historical inflection point where parabolic advances began in both 2017 and 2021. Bitcoin currently trades 44% below its all-time high of $126,296, reached on October 6, 2025.
Short-term traders should watch the $68,500 level closely. A daily close below that price invalidates the higher-low pattern established since March and opens a path to the $62,000-$63,000 range where significant bid liquidity sits on major exchanges. On the upside, reclaiming $75,000 with volume would confirm the accumulation thesis and target $82,000 as the next resistance.
XRP at $1.32: Regulatory Clarity or Continued Slide
XRP sits 63% below its $3.65 cycle high. Standard Chartered slashed its XRP target from $8.00 to $2.80, reflecting both geopolitical headwinds and slower-than-expected regulatory progress. The token’s near-term fate hinges almost entirely on whether the Senate Banking Committee advances the CLARITY bill.
Commodity classification would differentiate XRP from the hundreds of tokens still facing securities scrutiny and position Ripple for institutional product expansion beyond spot ETFs. On-chain, XRP’s active address count has declined 34% since December, suggesting retail exhaustion. Institutional flows through ETFs remain positive but have cooled significantly from the launch-month surge.
Ripple’s On-Demand Liquidity (ODL) corridors processed $14.2 billion in cross-border volume during Q1 2026, a 23% increase from Q4 2025 despite the price decline. That operational growth, combined with XRP’s sub-second settlement and negligible transaction fees, makes the fundamental case more compelling now than at December’s $3.65 price. The question is whether regulatory progress arrives fast enough to prevent further erosion of retail confidence.
What Extreme Fear Has Delivered Historically
The Fear & Greed Index below 10 for 30+ consecutive days has occurred exactly three times before. Each episode coincided with an event that felt like the end of crypto at the time. None of them were.
March 2020, during the COVID crash, the index hit 8 with Bitcoin at $5,000. Twelve months later it traded near $58,000. June 2022, after the Luna and Three Arrows Capital collapse, the index dropped to 6 with Bitcoin at $17,500. A year later: $30,400. November 2022, following the FTX implosion, the reading touched 10 with Bitcoin at $15,500. Twelve months later it reached $37,000.
Past performance does not guarantee future results. The current geopolitical environment introduces variables absent from prior cycles, including potential military conflict between two nuclear-armed states and an oil supply disruption through the Strait of Hormuz. But the on-chain signal remains unambiguous: large holders are treating the Islamabad collapse as a buying opportunity, not an exit.
Disclaimer: This article is for informational purposes only and does not constitute investment advice. TECHi and its authors may hold positions in securities mentioned. Always conduct your own research and consult a licensed financial advisor before making investment decisions.