President Donald Trump warned Tuesday morning that “a whole civilization will die tonight” if Iran fails to meet his 8 p.m. ET deadline to reopen the Strait of Hormuz. The threat, posted on Truth Social less than 12 hours before the deadline expires, represents the most extreme rhetoric from any U.S. president toward a foreign nation since the Cold War. For investors, the stakes are quantifiable: 21% of the world’s seaborne oil and a fifth of its liquefied natural gas transit the Strait. Shipping through the waterway has dropped 95% since Iran declared it closed on March 4. With Brent crude hovering near $111 per barrel and WTI above $116, the next 24 hours will determine whether markets get a ceasefire rally or an escalation crash.
Table of Contents
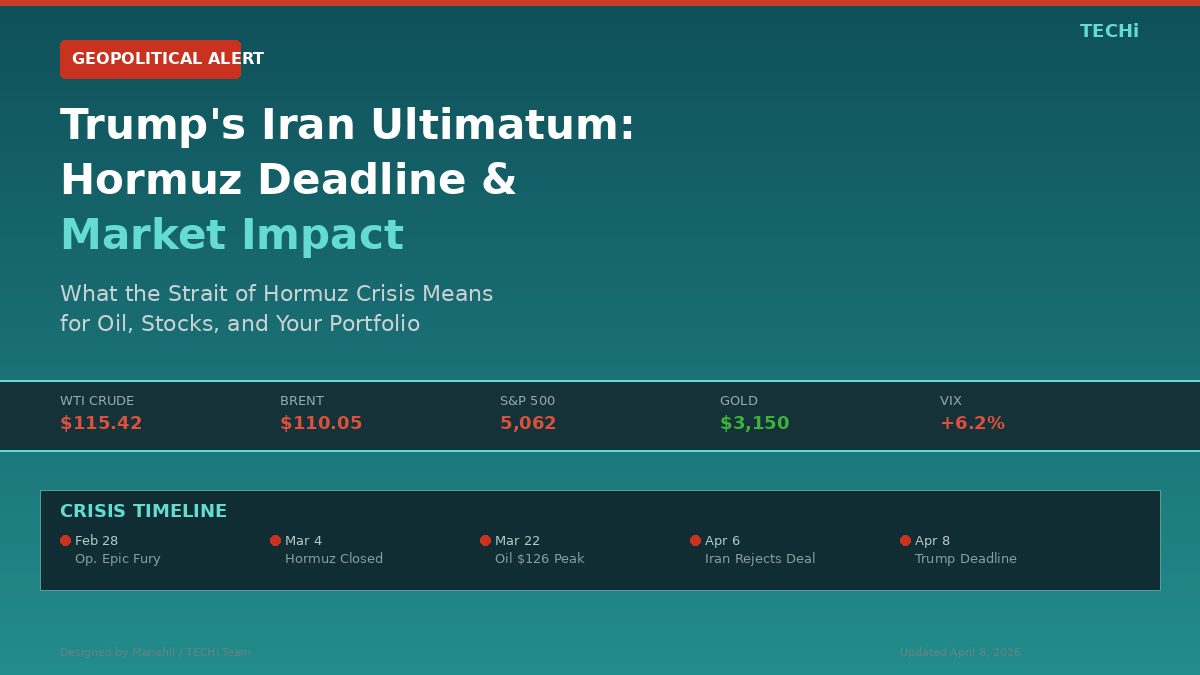
The Timeline: How We Got Here
The crisis unfolding at the Strait of Hormuz did not emerge overnight. It is the product of a five-week military campaign that has reshaped the geopolitical and energy landscape of the Middle East. Understanding the sequence of events is essential for any investor trying to price risk in this environment.
| Date | Event | Market Reaction |
|---|---|---|
| February 28, 2026 | U.S. and Israel launch Operation Epic Fury; coordinated airstrikes hit Iranian military facilities, nuclear sites, and IRGC headquarters | Brent crude jumps 8% in after-hours trading; S&P 500 futures drop 3.2% |
| March 4, 2026 | Iran declares Strait of Hormuz “closed” and attacks commercial shipping attempting transit | Brent surges past $95/bbl; gold rallies above $3,000/oz |
| March 10-14, 2026 | 150+ tankers anchored in open Gulf waters; global shipping reroutes around Africa | Shipping stocks surge; container rates spike 40% |
| March 22, 2026 | Brent crude peaks near $126/bbl as supply disruption fears hit maximum | S&P 500 enters correction territory; VIX spikes above 35 |
| April 2, 2026 | Trump delivers Iran war speech warning of 600 million barrels at risk | Oil pulls back slightly on diplomatic hopes |
| April 6, 2026 | Iran formally rejects Pakistan-brokered “Islamabad Accord” ceasefire; sends 10-point counterproposal | WTI jumps 3% to $116; defense stocks rally |
| April 7, 2026 | Trump posts “a whole civilization will die tonight” on Truth Social; U.S. strikes Kharg Island | Crude tops $116; S&P 500 halts four-day advance |
| April 8, 2026 | 8 p.m. ET deadline for Iran to reopen Hormuz or face infrastructure strikes | Markets in wait-and-see mode |
The Operation Epic Fury campaign targeted Iranian command and control centers, ballistic missile sites, navy vessels, anti-ship missile batteries, and air defense systems. The operation resulted in the death of Supreme Leader Ali Khamenei, fundamentally altering the political dynamics of the conflict. Iran’s response was asymmetric but economically devastating: closing the world’s most important oil chokepoint.
Before the conflict, roughly 17 million barrels per day of crude oil flowed through the Strait of Hormuz. That volume has effectively dropped to near zero since March 4. The economic consequences extend far beyond oil; Qatar’s LNG exports, Bahrain’s trade flows, and Kuwait’s entire energy economy depend on the waterway. TECHi’s earlier analysis of Trump’s April 6 Iran deadline explored the initial market reactions as the conflict entered its diplomatic phase.
What Trump Actually Said (And What Markets Heard)
Presidential rhetoric during geopolitical crises has always moved markets. But the velocity and extremity of Trump’s public statements on Iran have created a new paradigm for volatility. Each Truth Social post and press conference clip now functions as an instantaneous catalyst for billions of dollars in asset price movement.
The post, reported by NBC News, landed less than 12 hours before the 8 p.m. ET Tuesday deadline. Markets reacted immediately. U.S. crude gained more than 3% to $116.22 per barrel by late morning. Brent futures climbed to $110.66, representing a roughly 50% increase since the war began on February 28.
At a subsequent press conference, Trump clarified that Iran would need to agree to “a deal that’s acceptable to me, and part of that deal is going to be, we want free traffic of oil and everything else.” The mixed messaging between apocalyptic threats and diplomatic overtures has defined this crisis. As CNBC reported, Trump’s Iran ultimatum and signals of a possible deal have kept investors “on tenterhooks,” unable to position decisively in either direction.
The market’s interpretation has been binary. Every statement suggesting diplomacy triggers a relief rally in equities and a pullback in crude. Every escalatory threat reverses both moves within hours. The S&P 500 rose 3.4% last week on hopes of a diplomatic resolution, only to give back gains Monday as the deadline approached without progress. This whipsaw pattern is unlikely to resolve until the deadline passes and the actual policy response becomes clear.
The Three Scenarios From Here
Investors need a framework for the three plausible outcomes of the April 8 deadline. Each scenario carries distinct implications for oil, equities, gold, and digital assets. The probability weightings below reflect consensus views from Goldman Sachs, JPMorgan, and Morgan Stanley research notes published in the first week of April.
| Scenario | Trigger | Oil Price | S&P 500 Impact | BTC Impact | Probability |
|---|---|---|---|---|---|
| Ceasefire within 2 weeks | Diplomatic deal reached; Hormuz reopens under international monitoring | $75-85/bbl | +5-8% rally | +15-20% | 30% |
| Prolonged standoff (3-6 months) | No deal, but partial Hormuz access under naval escort | $100-120/bbl | Flat to -5% | Range-bound | 45% |
| Full escalation | U.S. strikes Iranian infrastructure; Iran retaliates against Gulf allies | $130-150+/bbl | -15-20% | -25% initially | 25% |
The prolonged standoff scenario carries the highest probability because it requires the least action from either side. Iran’s 10-point counterproposal, delivered via Pakistan on April 6, demands a permanent end to hostilities, sanctions relief, and reconstruction guarantees. Those terms are non-starters for the Trump administration, but they signal Tehran’s willingness to negotiate rather than escalate. The U.S. military, meanwhile, has the capability to establish naval escort corridors through the Strait even without Iranian cooperation, as it demonstrated during the 1987-1988 Tanker War.
The full escalation scenario carries a 25% probability but disproportionate risk to portfolios. If U.S. strikes hit Iranian oil infrastructure, particularly Kharg Island (which handles 90% of Iran’s crude exports), retaliatory strikes against Saudi and Emirati facilities could remove an additional 5-8 million barrels per day from global supply. Macquarie analysts have projected Brent could reach $200 per barrel under a sustained Hormuz blockade extending through June 2026.
How Each Asset Class Is Positioned
The Iran crisis has created clear winners and losers across asset classes. Understanding current positioning is critical for portfolio decisions this week.
Oil and Energy
WTI crude at $116.22 and Brent at $110.66 represent the highest sustained prices since 2022. The gains are not speculative froth; they reflect a genuine supply disruption of historic proportions. Before the war, the Strait of Hormuz handled nearly a quarter of global seaborne oil. That volume is now effectively zero. ExxonMobil has surged 39% year to date, and Devon Energy leads the sector at +53%. TECHi’s guide to the best oil and energy stocks in 2026 covers the top beneficiaries of elevated crude prices. Meanwhile, U.S. gasoline prices have climbed to $4.14 per gallon, with diesel at $5.64, squeezing consumers and transport companies alike. The trajectory of gas prices today remains tightly correlated with Hormuz developments.
U.S. Equities
The S&P 500 sits near 6,582 after a choppy few weeks. The index rose 3.4% last week on diplomatic hopes, only to stall Monday as the deadline neared. Energy and defense remain the only sectors that benefit in two out of three scenarios, giving them a combined 75-85% probability of positive returns regardless of the diplomatic outcome. The remaining 85% of the market faces headwinds from rising input costs, consumer spending compression from higher gas prices, and the general risk-off posture that accompanies active military conflict.
Gold
Gold has reasserted its role as the ultimate geopolitical hedge. Prices near $4,650 per ounce are well above pre-crisis levels, having surged past $4,500 earlier in the crisis. In the full escalation scenario, analysts project gold could challenge the January 2026 all-time high of $5,589 per ounce. The bid under gold is structural, not speculative; central bank purchases and retail safe-haven demand both accelerate during active military conflicts involving major oil producers.
Bitcoin and Crypto
Bitcoin at roughly $68,800 is down approximately 45% from its all-time high of $126,080, with the Iran conflict serving as the primary catalyst for the decline. The cryptocurrency has not fulfilled its “digital gold” thesis during this crisis; instead, it has traded as a risk asset, declining alongside equities during escalation fears. Standard Chartered still projects $150,000-$200,000 under a bull scenario driven by ETF inflows and post-halving supply dynamics, but that thesis requires the geopolitical overhang to clear first. TECHi’s Bitcoin price prediction analysis covers the full range of scenarios, and the Bitcoin price today tracker provides real-time updates. For a deeper look at how crypto markets are responding to the conflict, TECHi’s analysis of crypto’s role as an Iran war hedge examines the 24/7 trading advantage digital assets offer during overnight geopolitical developments.
What Investors Should Do This Week
The April 8 deadline creates a binary event risk that demands careful positioning. Major investment banks have issued specific tactical guidance for the week ahead.
JPMorgan’s tactical desk recommends reducing gross equity exposure by 10-15% heading into the deadline. The rationale is straightforward: the downside risk from full escalation (-15-20% on the S&P 500) significantly outweighs the upside from a ceasefire rally (+5-8%). Asymmetric risk profiles like this favor capital preservation over upside capture.
Morgan Stanley’s cross-asset team highlights gold as the cleanest hedge, noting that it benefits in both the standoff and escalation scenarios. Their preferred trade is long gold, long energy, and short consumer discretionary via sector ETFs. For retail investors without the ability to short sectors, the simplified version is: overweight energy and precious metals, trim growth and consumer exposure, and maintain higher-than-normal cash reserves until the Hormuz situation resolves.
Three specific data points to watch this week beyond the headline deadline: first, any indication of naval escort corridors being established through the Strait, which would signal the prolonged standoff scenario; second, the State Department’s response to Iran’s 10-point counterproposal, which could reopen diplomatic channels; and third, OPEC+ emergency meeting rhetoric, as Saudi Arabia and the UAE have the spare capacity to partially offset lost Hormuz flows if they choose to reroute via Red Sea pipelines.
Oil Price Technical Snapshot
WTI Crude: ~$116.22/bbl | Brent: ~$110.66/bbl
Pre-War Brent (Feb 27): ~$74/bbl | Peak (Mar 22): ~$126/bbl
Hormuz Shipping Volume: Down 95% from pre-war levels
U.S. Gasoline: $4.14/gal | Diesel: $5.64/gal
Next Catalyst: April 8, 8 p.m. ET Trump deadline
Crude oil prices have settled into a trading range between $105 and $120 over the past two weeks as markets attempt to price the competing forces of supply disruption and diplomatic hope. The $126 peak on March 22 represented maximum fear pricing. Since then, intermittent reports of back-channel negotiations have capped the upside, while the physical reality of a closed Strait has prevented any meaningful pullback. A ceasefire would likely send Brent back toward $75-85 within days as traders unwind the war premium. Full escalation would test the 2008 all-time high of $147, with Macquarie projecting a potential move to $200 under a sustained multi-month disruption.
The Bottom Line
The Strait of Hormuz crisis is the most significant geopolitical disruption to global energy markets since the 1973 Arab oil embargo. The comparison is not hyperbole: 21% of the world’s seaborne oil is effectively locked behind a military blockade, and the U.S. president has threatened to destroy a nation’s infrastructure within hours. Markets are pricing roughly 45% odds of a prolonged standoff, 30% odds of a ceasefire, and 25% odds of full escalation. Those probabilities will shift rapidly as the 8 p.m. ET deadline passes.
For long-term investors, the actionable insight is not to predict which scenario materializes but to position portfolios that perform acceptably across all three. Energy and defense benefit in two of three outcomes. Gold benefits in all three. Cash provides optionality to buy the dip if equities sell off on escalation. The one positioning error to avoid is being fully invested in growth and consumer sectors with zero hedges, which is precisely where most retail portfolios sit heading into the most volatile week for oil markets in half a century.
The diplomatic window is not closed. Iran’s 10-point counterproposal, while unacceptable in its current form, signals engagement rather than entrenchment. Pakistan’s mediation role provides a channel that both sides can use without direct political cost. Trump’s own mixed messaging, alternating between existential threats and offers to make a deal, suggests the deadline may prove to be a pressure tactic rather than an irrevocable commitment. But “probably will” is not the same as “won’t,” and portfolios positioned for hope alone have historically paid the price when geopolitical risks materialize.
Disclaimer: This article is for informational purposes only and does not constitute investment advice, a recommendation, or a solicitation to buy or sell any securities. The financial data, projections, and analysis presented reflect publicly available information and the editorial judgment of TECHi’s research team. All investors should conduct their own due diligence or consult a qualified financial advisor before making investment decisions. Past performance is not indicative of future results. TECHi and its authors may hold positions in the securities discussed.