

Archival photograph of TSMC’s Hsinchu facility, 2009. Photo: Arusanov / Wikimedia Commons; public domain. Cropped for publication; TECHi publisher mark added.
TSMC cleared the two operating tests set out in this article’s October 5 preview: September sales completed a strong quarter, and third-quarter revenue exceeded management’s guidance while gross margin stayed inside its forecast range. The results provide a firmer basis for evaluating the business than the share-price advance that prompted the original preview.
The company’s third-quarter results show US$46.72 billion in revenue, 66.4% gross margin and 58.7% operating margin. TECHi calculates that revenue finished about 2.0% above the US$45.8 billion upper end of guidance, while operating margin exceeded its 58% upper bound by 0.7 percentage points. Those are operating results, not a forecast of what the stock will do next.
What the results show
- RevenueUS$46.72 billion, about 2.0% above the US$45.8 billion high end of Q3 guidance.
- Profitability66.4% gross margin met guidance; 58.7% operating margin exceeded the range.
- Next periodQ4 revenue guidance is US$52.3–US$54.3 billion; this remains a company forecast.
What the October results establish
The original question was whether sales growth would translate into profitability. A revenue beat alone would have left room for concern about costs, product mix or the expense of expanding capacity. These results answer that question more directly: revenue exceeded the guided range, gross margin remained within it, and operating margin came in above it.
The distinction matters because a good business result and a good investment return are separate propositions. A company can perform strongly while its shares fall if investors expected even more. This update therefore evaluates the reported figures against the company’s published guidance. It does not attribute a subsequent share-price move to the release without a dated market observation.
| Measure | Company guidance | Actual result |
|---|---|---|
| Revenue (US$ billion) | 44.6–45.8 | 46.72 |
| Gross margin | 65%–67% | 66.4% |
| Operating margin | 56%–58% | 58.7% |
Revenue beat the upper end by about 2.0%
TSMC’s revenue range was US$44.6 billion to US$45.8 billion. Actual revenue of US$46.72 billion exceeded the top of that range by US$0.92 billion. Dividing that difference by US$45.8 billion gives approximately 2.0%. The denominator is the upper end of company guidance, not analyst consensus or the preceding quarter.
The midpoint comparison answers a different question. The midpoint was US$45.2 billion, so actual revenue was US$1.52 billion, or about 3.4%, higher. Both comparisons are useful, but they should not be exchanged casually: a beat against the midpoint will naturally look larger than a beat against the high end. Neither calculation establishes how the result compared with every investor’s expectations.
Company guidance also has a different status from an independently assembled consensus estimate. It is management’s forecast under stated assumptions. Beating it establishes an observable comparison with that forecast; it does not, by itself, prove a surprise relative to the expectations already reflected in the share price. That is why the actual result, comparator and calculation need to remain together.
Margins give the revenue result more substance
Gross margin of 66.4% landed inside the 65%–67% range. It was 0.4 percentage points above the 66% midpoint and 0.6 points below the upper bound. The appropriate conclusion is that gross profitability held within guidance. Calling it a gross-margin beat would erase the difference between meeting a range and exceeding it.
Operating margin of 58.7% exceeded the 56%–58% range. The 0.7-point excess above the upper end shows that the quarter converted revenue into operating profit more effectively than the company’s original range implied. It is a stronger result on this particular comparison than simply meeting the midpoint. Percentage points describe the difference between these margins; a percentage change would be a different calculation.
Reading the two margins together is more informative than selecting the stronger one. Gross margin describes profitability after the costs included in gross profit. Operating margin includes the additional operating-expense layer. The difference between the two measures can help frame questions about operating leverage, but the headline margins alone cannot isolate the contribution of each factory, technology or customer.
Nor do these figures identify an AI-only revenue stream. A strong foundry quarter is evidence about the company’s reported operations. Attributing a precise portion of the beat to AI orders would require an additional, appropriately defined disclosure. The results support a measured conclusion about revenue and margins without requiring that unsupported extension.
September’s small decline still completed a strong quarter
The 2026 monthly revenue table records September revenue of NT$511.857 billion, compared with NT$514.806 billion in August. TECHi calculates a sequential decline of about 0.6%: the NT$2.949 billion difference divided by August’s NT$514.806 billion. September nevertheless increased 54.6% from a year earlier, according to the same company table.
The monthly decline and annual growth describe different comparisons. A small fall from August does not contradict a large increase from the preceding September. Treating either one as the whole story would conceal information readers need. TECHi’s earlier September-sales analysis examines that monthly-versus-quarterly distinction in more detail.
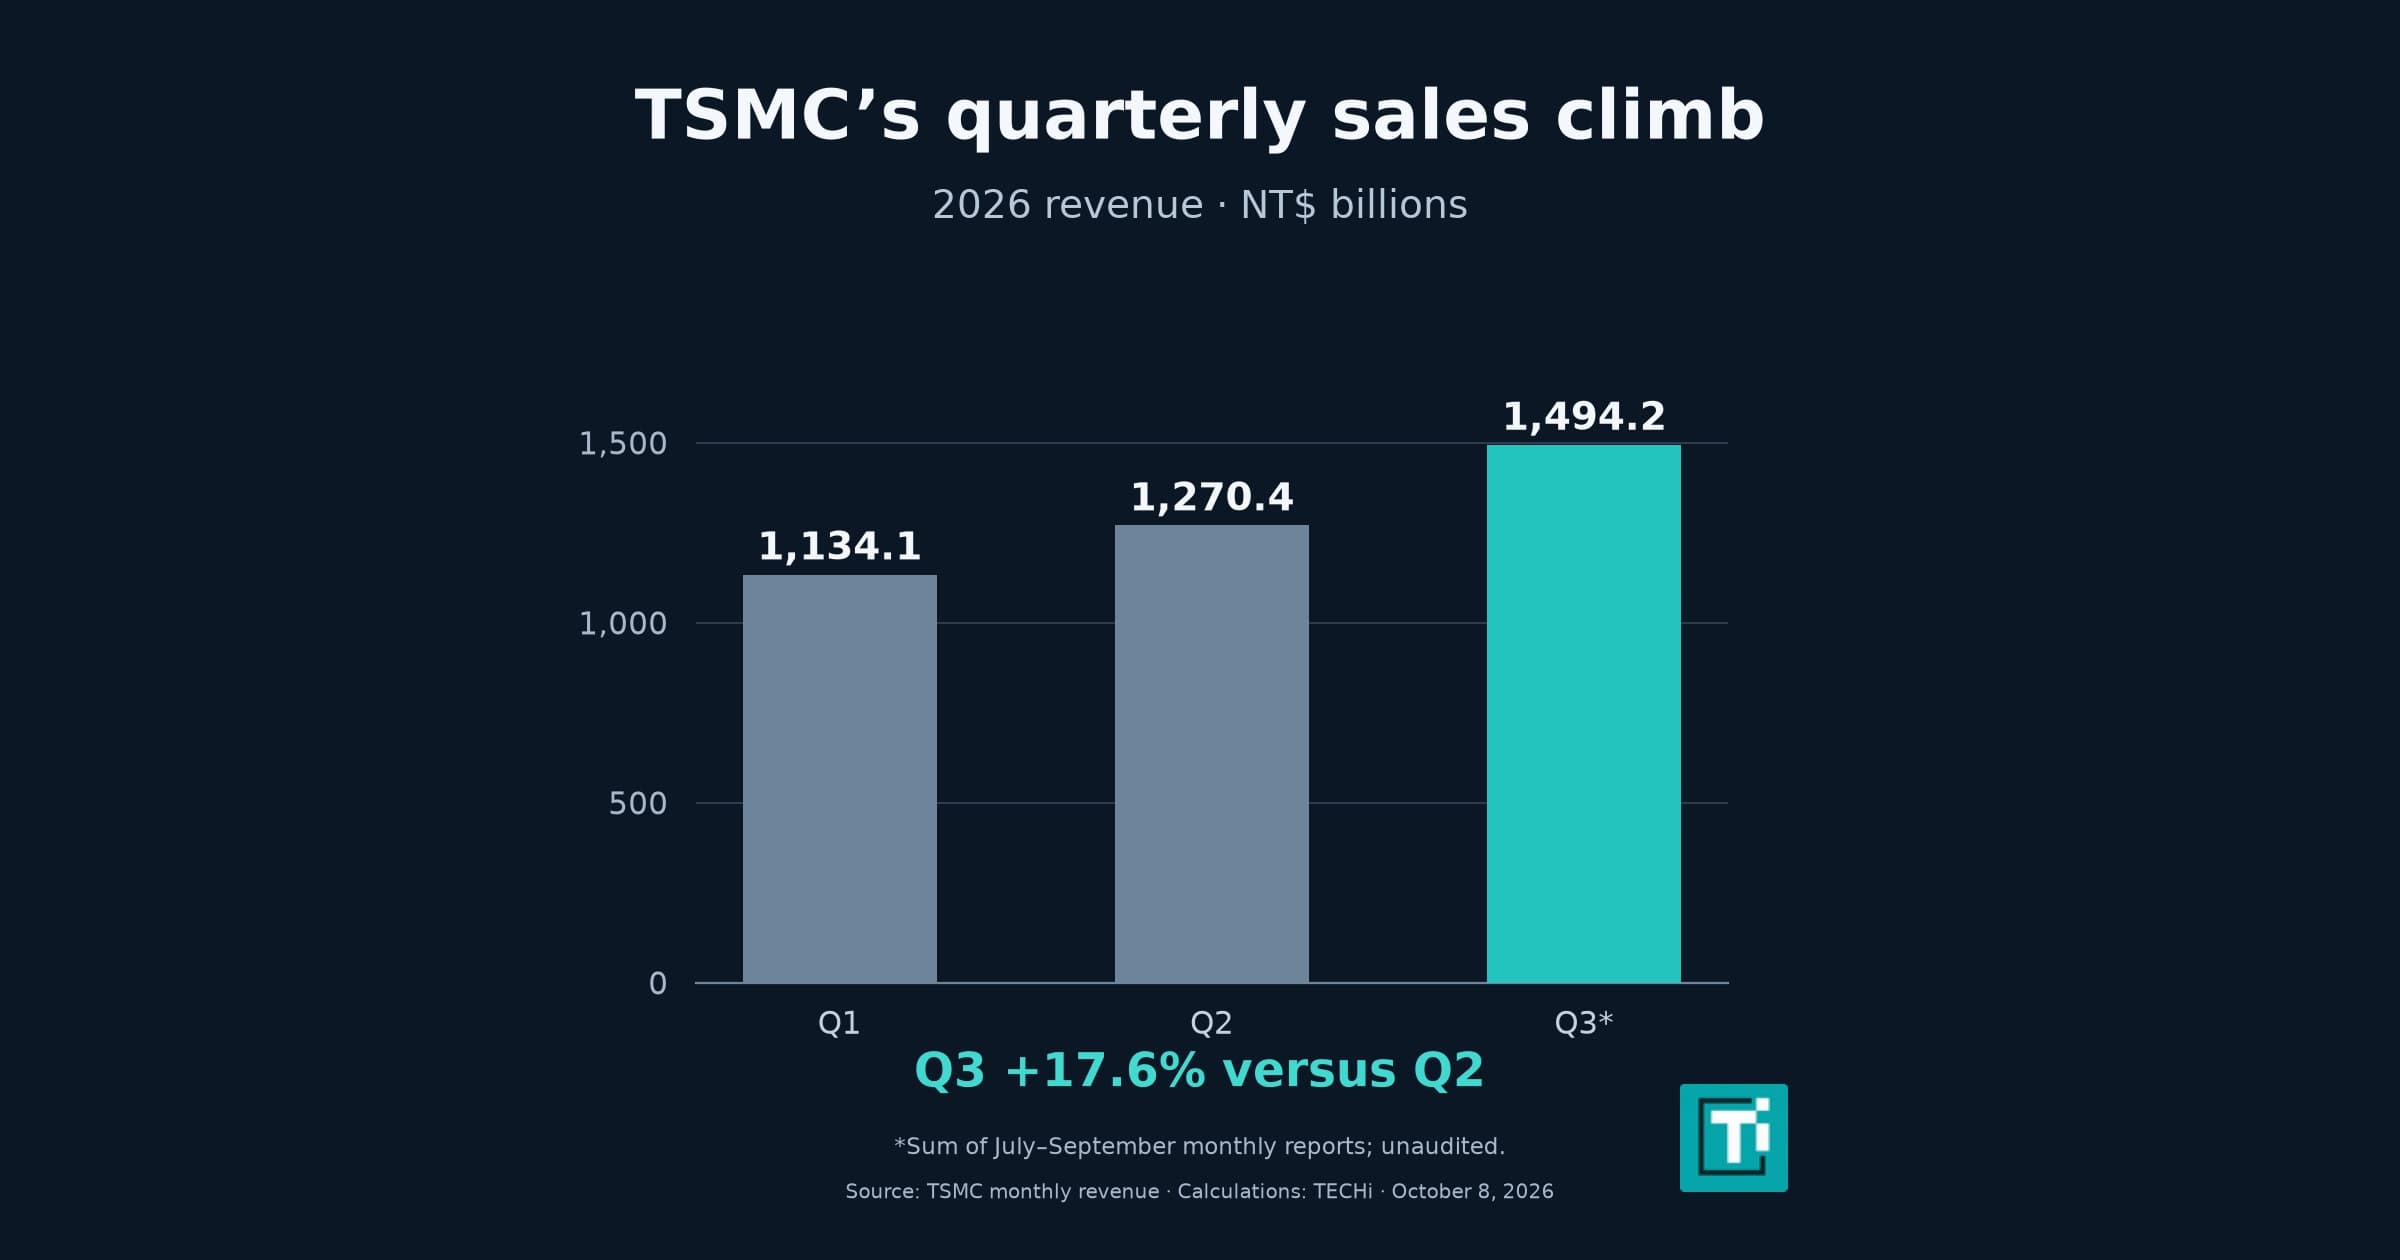
Adding July’s NT$467.580 billion, August’s NT$514.806 billion and September’s NT$511.857 billion gives NT$1,494.243 billion for the quarter. This reconstruction is useful because it shows how a modest sequential decline in the final month can coexist with a substantial quarterly revenue base. The monthly table marks its 2026 figures as unaudited, a qualification that belongs with the numbers.
The monthly series is denominated in New Taiwan dollars, while the quarterly guidance comparison above uses US dollars. Those currencies should remain explicit. A reader should not compare the two totals as though they were expressed in the same unit or convert them using an arbitrary current exchange rate. For the US-dollar guidance test, the company’s own quarterly reported figure is the appropriate comparator.
Results against pre-earnings expectations
This page originally asked whether the scheduled September-sales and Q3 disclosures could validate the operating expectations behind a stock rally. Those releases are now available. The central uncertainty has therefore changed from whether the quarter would meet those tests to what the results imply for the next period.
TSMC’s US-listed depositary shares trade as TSM on the New York Stock Exchange; the company’s ordinary shares have a separate Taiwan listing. The issuer’s listing announcement documents the US listing.
The article’s publication-time quote remains a historical observation rather than a current trading signal. Any optional refreshed quote is shown separately with its own observation time and provider. Refreshing a card does not revise the article’s publication date, and an observation from a closed session should not be presented as a real-time trade. Historical valuation and target figures that could not be reconstructed from a durable dated source have been removed from this update.
The next test is the new guidance
TSMC’s Q3 results page now gives fourth-quarter revenue guidance of US$52.3 billion to US$54.3 billion, gross margin guidance of 65%–67%, and operating margin guidance of 56.5%–58.5%. These are company forecasts. They should not be described as already earned revenue or promised investment returns.
The new revenue midpoint is US$53.3 billion. Against Q3’s US$46.72 billion, that would imply growth of about 14.1% if achieved. The calculation is US$6.58 billion divided by US$46.72 billion. It expresses the scale of the company’s forecast rather than an independent TECHi prediction. Results outside the range, revised assumptions or a material change in margins would require a new assessment.
A higher revenue range alongside the same gross-margin band also gives readers a specific question to follow: can the company deliver the forecast revenue while sustaining that profitability range? The answer needs reported evidence. Extrapolating one quarter indefinitely would overlook execution costs, changes in product mix and shifts in demand.
What to watch
The next dated checkpoint in the monthly reporting sequence is October revenue, once TSMC publishes it in its monthly revenue table. Readers can check the financial calendar for the confirmed release schedule. Until a new figure is disclosed, the blank October cell is not a result and should not be filled with an assumption.
For the next earnings report, compare actual revenue and both margin measures with the corresponding Q4 guidance. Keep the period, currency, source and denominator attached to each comparison. That approach preserves the useful part of the original preview: a set of explicit operating tests that can be checked against reported results, with a clear account of what would change the conclusion.

Disclaimer
This article is for informational purposes only and does not constitute financial, investment, tax, or legal advice. Market data, tax rules, and prices can change after the article date. TECHi and its authors may hold positions in securities or digital assets mentioned. Always conduct your own research and consult a licensed financial, tax, or legal professional before making decisions.



Comments