- The SetupBrent $86.84, WTI $79.78 on April 17, 2026 after the US-Iran ceasefire and Hormuz reopening. Crude down 24% from early-April peak.
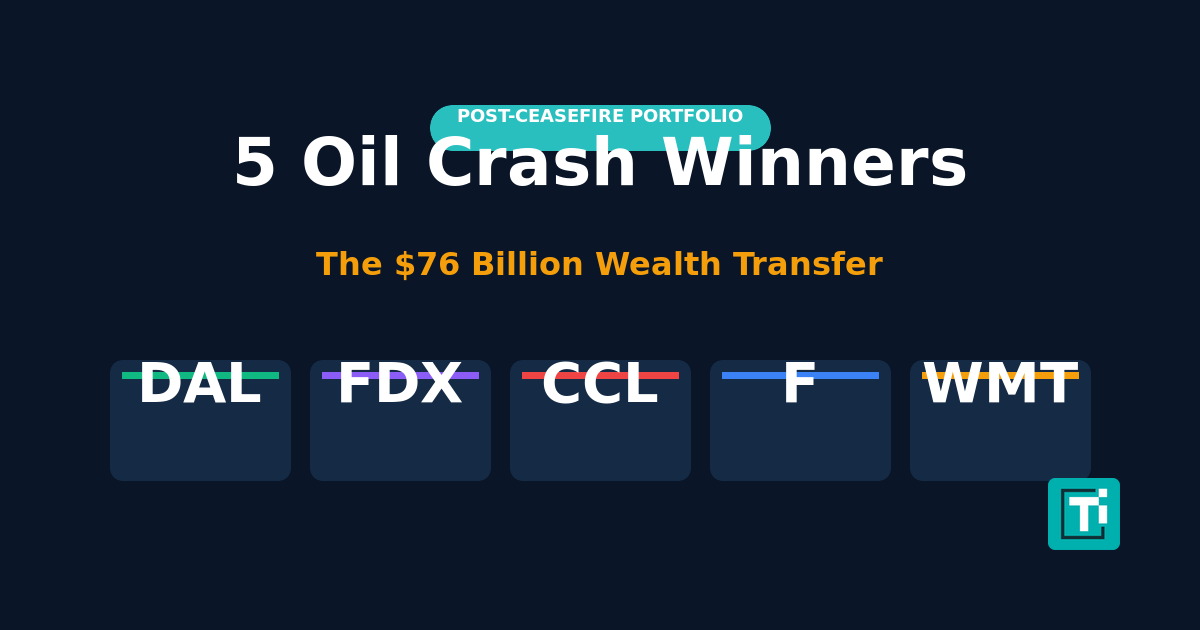
- $76B TransferS&P 500 Energy sector loses ~$76 billion of realized revenue to the crash. Equal dollars transfer to airlines, shippers, consumer discretionary, and mass retail.
- Biggest SetupDelta (DAL) guided Q2 EPS on a $4.30/gal jet fuel assumption that is now invalidated — implied $1.5B pretax tailwind vs consensus.
- Deepest ValueFord (F) at $12.44 with $9B+ Ford Pro EBIT. F-Series sales historically accelerate 60-90 days after pump prices drop below $3.75.
- RisksCeasefire collapse, OPEC+ supply cut on May 3, or macro demand deterioration. Supply-driven crash is bullish setup; demand-driven crash inverts the thesis.
Brent crude settled at $90.38 on April 17, 2026 (session low $86.09), down roughly 20% from the $112.57 peak on March 27 and down 9.1% in a single session after Iran confirmed the Strait of Hormuz is "completely open" and Trump signaled direct peace talks are advancing. The S&P 500 Energy Sector, a $760+ billion annual-revenue combine led by ExxonMobil ($350B), Chevron ($203B), and ConocoPhillips ($57B), is watching a roughly 10% top-line compression drain out of 2026 earnings as the war premium unwinds. That is not just a sector rotation. It is a measurable $76 billion annual wealth transfer from energy producer margins into energy consumer margins. Every dollar Exxon loses on realized crude pricing is a dollar Delta does not spend on jet fuel, Carnival does not spend on bunker, Ford does not need its customers to spend at the pump, and Walmart's low-income shopper gets to redirect to discretionary groceries. The 5 stocks below are the clearest downstream beneficiaries, and in three cases, the recent Q1 guidance assumed oil prices that have already been invalidated by the post-ceasefire crash.
The $76 Billion Wealth Transfer Explained
When oil falls 10%, the S&P 500 Energy sector loses roughly 10% of its realized revenue on every barrel sold. Applied to the ~$760 billion aggregate top line of the 23 XLE constituents, that is a $76 billion annual-run-rate figure that does not disappear. It transfers. The buyer of the crude was already paying that $76 billion. When the price drops, the buyer keeps it. What happens next is a mechanical redirection of margin dollars from producer P&Ls into consumer-facing sectors: airlines (jet fuel), shippers (diesel), cruise operators (bunker), automakers (dealer foot traffic), and mass-market retailers (discretionary spend). This is not theory. It is published corporate guidance being rewritten in real time.
The key insight most contrarian plays miss: three of the five names below issued Q1 or full-year guidance that explicitly assumed higher oil prices than now exist. That guidance becomes the floor, not the ceiling, for the next earnings cycle. When the market prices in the crude crash, these names are the first to get upward EPS revisions. For a live view of where oil sits today and why, see our Brent & WTI live tracker; for broader market context, stock market today has the cross-asset picture.
#1 Delta Air Lines (DAL): The Pure Fuel Leverage Play
Delta Air Lines (NYSE: DAL)Apr 16, 2026 close
$69.89Analyst target: $79.45 avg (+13.7%)
Q1 2026 Revenue$14.2B (record)
Q2 2026 Guide$1.00–$1.50 EPS
Q2 Fuel Assumption$4.30/gal jet
Consensus RatingStrong Buy (25 analysts)
Delta reported a record $14.2 billion in Q1 2026 revenue on April 8 but guided Q2 adjusted EPS sharply lower at $1.00 to $1.50, down from $2.10 in the prior-year comparison. The reason was one number: management assumed an all-in jet fuel price of $4.30 per gallon, based on the forward curve on April 2 when Brent was trading at $112. That forward curve is now dead. With Brent at $86.84 and jet fuel typically tracking crack spreads over crude, the realistic Q2 jet fuel average is closer to $2.80 to $2.95 per gallon.
Delta burns approximately one billion gallons of jet fuel per quarter. The implied delta between the guidance assumption ($4.30) and the post-ceasefire reality (~$2.87) is about $1.43 per gallon, or roughly $1.4 billion of pretax fuel savings that the April 8 guidance did not anticipate. Even after accounting for ticket-price clawbacks that typically follow fuel declines (airlines pass roughly half the savings to consumers through fare competition), Delta is looking at a Q2 EPS beat setup that the market has not yet priced in. CNBC's earnings coverage noted that Delta also has a structural buffer most airlines lack: the Trainer refinery in Pennsylvania, which contributes roughly $300 million of annual earnings and acts as a natural hedge on crack spreads.
Upside scenario: $85 to $95 by year-end 2026 if Q2 EPS prints above guidance and management raises FY26 on the July call. The catch: airline demand has historically softened during oil-crash cycles because the same macro-weak narrative that crashes oil also crashes discretionary travel. Watch the July quarterly for commentary on corporate travel bookings, which held through the March-April volatility but remain the single biggest variable for the 2026 print.
#2 FedEx (FDX): The Quiet Margin Expansion
FedEx (NYSE: FDX)Apr 16, 2026 close
$380.88Analyst target: $376 avg · Street high $479
Q3 FY26 Revenue$24.0B (beat)
Q3 Adj. EPS$5.25 vs $4.09 est.
FY26 Guide (raised)$19.30–$20.10
Consensus RatingModerate Buy (24 analysts)
FedEx already raised its FY26 guidance on March 19, 2026 before the oil crash was complete. The new range of $19.30 to $20.10 in adjusted EPS is built on a fuel assumption that has been overtaken by reality. FedEx's operating fleet (roughly 700 aircraft and 200,000 ground vehicles) is one of the largest commercial fuel consumers in the United States. Diesel prices lag crude but generally move in the same direction over a 30- to 60-day window. With WTI at $83.85 and Brent at $90.38, the diesel complex is already pricing a full rollover from the March-April highs.
The setup is cleaner than Delta's because FedEx does not face the airline-specific demand risk. Parcel volumes are structurally driven by e-commerce growth and B2B shipping, both of which benefit from the same lower-inflation, softer-dollar regime that oil's crash is producing. The FedEx Q3 FY26 release also noted that the Federal Express segment, which absorbed Ground in FY25, is running ahead of pace on the DRIVE cost-reduction program, layering a second tailwind on top of the fuel pass-through.
Upside scenario: $420 to $450 by year-end 2026 on a Q4 FY26 beat (reported June 2026) plus an FY27 guide that captures a full year of lower fuel. The catch: the Street is already roughly in-line with the target at $376. This is a grind-higher idea, not a lottery ticket.
#3 Carnival (CCL): The Double Beneficiary
Carnival (NYSE: CCL)Apr 16, 2026 close
$27.31Analyst target: $37.75 avg (+38.2%)
Q1 FY26 Net Income$275M (+55% YoY)
Prior Fuel Headwind$500M / $0.38 EPS
FY26 EPS Est.$2.42
Consensus RatingStrong Buy (19 of 25 Buy)
Carnival offers a cleaner setup than either Delta or FedEx for one reason: management publicly quantified the oil headwind. In the Q1 FY26 release, Carnival called out a $500 million annual fuel headwind (equivalent to $0.38 per share) tied specifically to Middle East geopolitical risk. That headwind is now unwinding in real time. The company's 2024 filings show fuel consumption of roughly 2.9 million metric tons at an average cost of $617/ton, for total fuel expense of approximately $1.9 billion. A 15% drop in bunker prices, tracking roughly with the crude move, removes $285 million to $500 million of the headwind, depending on how much bunker lags vs crude.
The second beneficiary mechanic is consumer discretionary. Gasoline at $3.69 per gallon (down from the $4.14 April peak) puts an extra $40-$60 per month back into the average middle-income household's discretionary budget. Cruise bookings are one of the most directly gasoline-sensitive travel categories because roughly 30% of U.S. cruise customers drive to the embarkation port. Lower pump prices increase both the probability of booking and the willingness to add onboard spending. Carnival's Q1 FY26 already showed record onboard spending before the oil crash even started.
Upside scenario: $34 to $40 by year-end 2026 on FY26 EPS revisions and the $2.5 billion buyback authorization that executes faster in a cheap-fuel environment. The catch: $27.5 billion of net debt still on the balance sheet makes Carnival the most interest-rate-sensitive name in this list. A surprise hawkish Fed pivot would compress valuations fast.
#4 Ford (F): The Truck-Buyer Psychology Trade
Ford Motor Company (NYSE: F)Apr 16, 2026 close
$12.44Analyst target: $13.96 avg · Street high $17
FY25 Revenue$187.3B (record)
Ford Pro FY24 EBIT$9.0B+
Ford Blue FY24 EBIT$5.3B
Consensus RatingHold (13 analysts)
Ford is the most contrarian pick on the list because the stock has been stuck in the $10-$13 range all year, and the analyst community rates it a collective Hold. That positioning is precisely why the upside is asymmetric. Ford's profit pool is dominated by the F-Series pickup franchise (America's best-selling vehicle for 47 consecutive years) and the Super Duty commercial truck line housed in the Ford Pro segment. In FY2024, Ford Pro delivered more than $9 billion in EBIT, larger than Tesla's entire automotive operating profit for the same period.
The relationship between gasoline prices and pickup truck demand is one of the most empirically robust in auto history. When regular gasoline drops below $3.75 per gallon, F-Series sales accelerate within 60 to 90 days as buyers who had been deferring upgrade decisions return to showrooms. Ford's Q4 2025 results included a $900 million tariff hit that depressed earnings, a one-time drag that obscured the underlying operational strength. With pump prices now heading lower and tariff absorption fully in the base, the setup for FY26 H2 is cleaner than the sell-side consensus acknowledges.
Upside scenario: $15 to $17 on a truck-volume re-acceleration plus a potential Q3 guidance raise. The catch: Ford's EV business continues to bleed cash, and lower gasoline prices technically widen the economic gap between an F-150 Lightning and a gasoline F-150. Investors should ignore the EV side of the narrative and focus on the Pro + Blue profit pools, which dominate.
#5 Walmart (WMT): The Gas-to-Groceries Transfer
Walmart (NYSE: WMT)Apr 16, 2026 close
$124.82Analyst target: $138.85 avg (+11.2%)
Q4 FY26 U.S. Sales$129.2B (+4.6%)
U.S. Comp Sales (ex-fuel)+4.6%
E-commerce Growth+27%
Consensus RatingStrong Buy (28 of 30 Buy)
Walmart is the cleanest "wealth transfer" proxy in the S&P 500. The company's Q4 FY26 release showed U.S. comparable sales (excluding fuel) up 4.6% with transactions up 2.6% and ticket up 2.0%, a healthy mix well before the oil crash. Management has historically pointed to lower gasoline prices as a tailwind that frees household discretionary spending, and the mechanics are straightforward: the median American household drives approximately 13,500 miles per year at 22 MPG, using roughly 615 gallons of gasoline annually. A 45-cent drop in the pump price (from $4.14 to $3.69) puts $277 per year (roughly $23 per month) back into that household's budget.
A portion of that savings flows to discretionary grocery upgrades and general merchandise, both of which are Walmart's highest-margin U.S. categories. Walmart's Q3 FY26 also disclosed that households earning over $100,000 drove 75% of the company's market share gains, so the traditional "low-income only" framing understates the current setup. The 2026 Walmart investor is buying an omnichannel retailer with 27% e-commerce growth that happens to also benefit from cheaper gasoline at the exact moment its higher-income customer is already accelerating share of wallet.
Upside scenario: $138 to $145 by year-end 2026 with the announced $30 billion buyback providing a consistent bid. The catch: at 31x forward earnings, Walmart already trades at a premium to its 10-year average. This is a compounder-at-a-full-price name, not a cheap deep-value play.
What You Shouldn't Own Here
The companion trade to owning oil-crash winners is avoiding (or underweighting) the mirror-image losers. The first and most obvious is U.S. large-cap integrated oil itself. See our live oil price tracker for the full sector context, but the direct implication is clear: every dollar of revenue the XLE loses to lower realized crude is a dollar that does not flow to ExxonMobil, Chevron, or ConocoPhillips shareholders.
Less obvious: renewable energy and EV infrastructure stocks. When gasoline gets cheap, the relative economics of EV ownership narrow, and utility-scale renewables lose pricing power against newly-cheap natural gas. The 2014-2016 oil crash coincided with a 40%+ drawdown in the TAN solar ETF, history the 2026 version of the same crash is already beginning to rhyme with. Investors optimizing for the "oil crash winners" thesis should not double-count by simultaneously holding Plug Power or ChargePoint-adjacent names that historically trade opposite to this setup.
And one genuinely contrarian caveat: gold. Despite the lower-inflation narrative that typically accompanies oil crashes, gold has actually rallied to $4,867 as of April 17 because the same dollar weakness that supports oil-crash winners also supports non-yielding bullion. Gold is a coincident beneficiary of this setup, not a counter-trade.
Portfolio Allocation Framework
A reader working with $10,000 and looking to express the oil-crash-winners thesis without over-concentrating in any single name would weight roughly as follows: 25% Walmart (core compounder with buyback support), 25% FedEx (highest operational certainty), 20% Delta Air Lines (biggest EPS-beat setup), 20% Carnival (deepest upside if the thesis plays out), and 10% Ford (deepest value if truck cycle re-accelerates). This construction captures the thesis across five different channels (fuel cost, fuel volume, consumer discretionary, capital goods, and mass retail) without concentration risk in any one mechanism.
For investors who prefer ETF-level exposure over single stocks, a $10,000 allocation split evenly between IYT (iShares Transportation Average) and XRT (SPDR Retail) captures roughly 70% of the thesis with zero company-specific risk. The tradeoff is giving up the EPS-revision catalyst that makes the individual names (Delta and Carnival especially) the sharper trades.
Risks That Could Reverse This Setup
Ceasefire collapse. The Iran ceasefire has held nine consecutive sessions as of April 17, but geopolitical ceasefires have broken before. A Hormuz reclosure would snap Brent back toward $100-110 and invalidate the entire premise. Monitor the TECHi ceasefire tracker for any inflection signals.
OPEC+ production discipline. The OPEC+ ministerial meeting on May 3, 2026 could produce a supply-cut announcement that offsets the ceasefire-driven selloff. Saudi Arabia retains roughly 2 million barrels per day of spare capacity that can be withheld from the market.
Consumer demand deterioration. The same macro conditions that crash oil prices (weaker global growth, softer Chinese demand, slowing shipping volumes) also crash airline bookings, cruise reservations, and discretionary retail spending. The cleanest version of the oil-crash-winners trade is one where oil falls because supply increased, in this case Hormuz reopening, rather than demand collapsed. So far in 2026, this has been a supply story. If that changes, the thesis inverts.
Tariff re-escalation. Ford's Q4 2025 $900 million tariff hit and Walmart's 2026 supply-chain exposure remain the two biggest idiosyncratic risks in this basket. A fresh tariff announcement targeting auto parts or Chinese consumer goods would compress both names well before the oil tailwind could offset the policy headwind.
FAQ
Frequently asked questions
Which stocks benefit when oil prices crash?
The five clearest S&P 500 beneficiaries of the April 2026 oil crash are Delta Air Lines (DAL), FedEx (FDX), Carnival (CCL), Ford Motor Company (F), and Walmart (WMT). Delta and FedEx benefit from lower jet fuel and diesel costs. Carnival benefits from both lower bunker fuel AND cheaper gasoline driving consumer cruise bookings. Ford benefits from cheaper gasoline boosting F-Series pickup sales. Walmart benefits as lower pump prices free household discretionary spending that flows to grocery and general merchandise.
How much will lower oil prices boost Delta's earnings?
Delta issued Q2 2026 guidance of $1.00 to $1.50 adjusted EPS on April 8, 2026, based on an all-in jet fuel assumption of $4.30 per gallon. With Brent crude settling at $90.38 on April 17 (session low $86.09), the realistic Q2 jet fuel average is closer to $2.80 to $2.95. Delta burns roughly one billion gallons per quarter, so the roughly $1.43-per-gallon gap vs guidance equals approximately $1.4 billion of pretax fuel savings that the April 8 guidance did not anticipate. That sets up a Q2 EPS beat that is not currently in consensus estimates.
Do renewable energy stocks benefit from cheaper oil?
No. Renewables typically underperform when oil crashes. Cheaper gasoline narrows the economic advantage of electric vehicles, and cheap natural gas (which tracks oil) takes pricing power away from utility-scale solar and wind. During the 2014-2016 oil crash, the TAN solar ETF fell more than 40%. Investors positioning for the 2026 oil-crash winners thesis should not simultaneously hold renewable energy names that historically trade opposite to this setup.
What is the $76 billion wealth transfer from the oil crash?
The S&P 500 Energy Sector generates approximately $760 billion in annual revenue across its 23 XLE constituents, led by ExxonMobil ($350B), Chevron ($203B), and ConocoPhillips ($57B). A 10% drop in realized crude prices translates to roughly $76 billion of annual revenue compression for energy producers, revenue that does not disappear, but transfers to buyers of that crude. Airlines, shippers, cruise operators, automakers, and mass retailers capture most of that transfer through lower input costs or higher consumer discretionary spending.
What could reverse the oil-crash-winners trade?
Three main risks. First, a ceasefire collapse that reopens the Iran conflict and snaps Brent back above $100. Second, an OPEC+ supply-cut announcement on May 3, 2026 that offsets the ceasefire-driven selloff. Third, consumer demand deterioration: the same macro weakness that lowers oil prices can also reduce airline bookings, cruise reservations, and discretionary retail, which would neutralize the positive impact of lower input costs. So far in 2026 the oil decline has been a supply story, not a demand story, so monitor that framing carefully.
Is Ford a good buy as oil prices crash?
Ford Motor Company (F) at $12.44 is the most contrarian name on this list. The stock has been stuck in a $10-$13 range all year with a Hold consensus, yet Ford Pro delivered over $9 billion in EBIT in FY2024, more than Tesla's entire automotive operating profit. When regular gasoline drops below $3.75 per gallon, F-Series pickup sales historically accelerate within 60 to 90 days. The April 2026 crash is taking pump prices toward the $3.69 level, which has historically marked the inflection point for truck-buyer psychology. Ford is the deepest-value oil-crash winner in this basket.
Disclaimer
This article is for informational purposes only and does not constitute financial, investment, tax, or legal advice. Market data, tax rules, and prices can change after the article date. TECHi and its authors may hold positions in securities or digital assets mentioned. Always conduct your own research and consult a licensed financial, tax, or legal professional before making decisions.
About the Author

Warisha Rashid writes about the intersection of corporate strategy, venture capital, and macro for TECHi — why certain acquisitions close when the Fed pivots, why a Series C prices at a markdown, and how capital rotation reshapes competitive positioning. She reads PitchBook, CB Insights, and S&P Capital IQ filings alongside the earnings commentary most coverage ignores. Her work focuses on M&A rationale, startup unit economics, and the policy signals that move private markets before they show up in public ones.