- The SetupNVDA at $198.35 with 22x forward P/E — the cheapest forward multiple since the AI rally began. $215.9B FY26 revenue banked, $78B Q1 FY27 guide waiting.
- Duration MathOil crash to $86.84 opens Fed-cut path. 50 bps drop in 10Y yield = ~10-14% multiple expansion for NVDA = $20-$28 upside on math alone, no earnings beat required.
- Next CatalystNVIDIA Q1 FY27 earnings May 20, 2026 (33 days from publish). Guide $78B. NVDA has beaten revenue in 22 of last 24 quarters.
- Street ConsensusMean target $273.57 (+36.5% upside). 41 Buy / 1 Hold / 1 Sell across 43 analysts — one of the most bullish consensus ratings in the S&P 500.
- Real Bear CaseHyperscaler custom silicon (TPU v7, Trainium 3, Maia 200, MTIA) caps NVDA multiple at 22-28x. Not existential — inference margin compresses, training/agentic workloads stay with NVDA.
The stocks that printed today were airlines, cruise lines, and retailers. The stock that should have printed, and will (probably in the next 33 days), was NVIDIA. Brent crashed 12.6% to $86.84, WTI crashed 15.8% to $79.78, and the 10-year Treasury yield barely moved (finishing at 4.26%, down from 4.32% on April 16) only because the market hasn't fully processed what a Hormuz reopening does to the inflation path. Once it does, rate-cut futures reprice, the 10-year follows, and NVDA, closing April 17 at $201.68 (up from $198.35 on April 16) on a 22x forward earnings multiple, becomes the largest single beneficiary of duration-driven multiple expansion in the S&P 500. Jensen Huang doesn't need to say anything. The $215.9 billion FY2026 revenue print and the $78 billion Q1 FY27 guide (reporting May 20) are already in the bank. What's new is the macro tailwind underneath it, and nobody is pricing it yet.
Why This Is the Cleanest NVDA Setup of 2026
NVIDIA Corporation (NASDAQ: NVDA)April 17, 2026 close
$201.68Analyst target: $273.57 avg (+35.7%)
Q4 FY26 Revenue$68.1B (+73% YoY)
Q4 Data Center$62.3B (record)
Q1 FY27 Guide$78.0B (±2%)
Forward P/E~22x
YTD 2026+8.1%
Consensus RatingStrong Buy (41 Buy / 1 Hold / 1 Sell)
The entire NVDA 2026 thesis for the next 33 days can be reduced to three sentences. The operational story is already banked: $215.9 billion in FY26 revenue, a 73% YoY Q4, and a $78 billion Q1 FY27 guide that explicitly assumes zero data center compute revenue from China. The valuation story is cheap for the growth: 22x forward earnings is the lowest forward multiple NVDA has traded at since the AI rally began. What's new is the macro story: the oil crash has mechanically opened a path for the Fed to cut in September that did not exist on April 7, and NVDA is the largest single duration-beneficiary name in large-cap US equities.
The rest of the market is busy trading airlines and cruise lines on the crude collapse. See our oil price tracker for why Brent finished Friday at $86.84 and WTI at $79.78. Those moves are direct. The NVDA move is second-order: oil cools inflation, inflation cools the 10-year yield, and the 10-year cooling lifts high-multiple growth stocks disproportionately. If you have to pick one name to own into a cooling-inflation/Fed-pivot regime, the math says NVDA.
The Duration Math: What 25 bps Actually Does to NVDA
This is the part most retail coverage skips. For a growth stock where 60–80% of discounted-cash-flow value sits in terminal value, a 25 basis point drop in the 10-year Treasury yield reduces the weighted-average cost of capital by roughly 25 basis points, which mechanically lifts terminal value by approximately 5–7% (framework per Financial Modeling Prep's equity-sensitivity analysis). Applied to a $198 stock, that's a $10–$14 multiple-expansion tailwind per 25 bps cut, before any earnings upside.
The 10-year Treasury yield closed Friday at 4.26% per the CBOE 10-Year Treasury Note Index, down from 4.32% on April 16 and meaningfully below the 4.48% high set before the oil tape broke. A move back to the 3.80% level (where it traded in early March before the Iran conflict spiked inflation expectations) implies approximately 9–13% further multiple expansion for NVDA on pure arithmetic, or roughly $220–$230 fair value off the current $201.68 print, independent of any Q1 FY27 earnings beat. A further move to 3.50%, which is where Goldman and JPMorgan models sit by year-end 2026 if the disinflation path holds, implies fair value closer to $240–$250. That is the setup Jensen doesn't need to engineer. It engineers itself.
The Oil → CPI → Fed Chain
Energy accounts for roughly 6.5% of the headline CPI basket but has outsized transmission effects through transportation, shipping, manufacturing inputs, and consumer gasoline. The March peak in crude (WTI at $111.99, Brent at $109.03) drove the implicit inflation premium higher and pushed Fed funds futures to price less than 5% probability of a June rate cut. That hawkish repricing pressured every duration asset in the market.
The April 17 collapse reverses the chain. Brent at $86.84 versus the $110 March peak implies a roughly 80 basis point headline-CPI drag over the next 60 days, per standard energy-pass-through models. That drag expands September cut probability materially. The June cut is still a long shot at ~5%, but the September path looks very different now than it did a week ago. The market hasn't fully rebuilt those probabilities yet, which is exactly why NVDA is interesting at $198 rather than $220. For the live yield and Fed-futures picture, see our stock market today dashboard.
What the Q4 FY26 Print Already Locked In
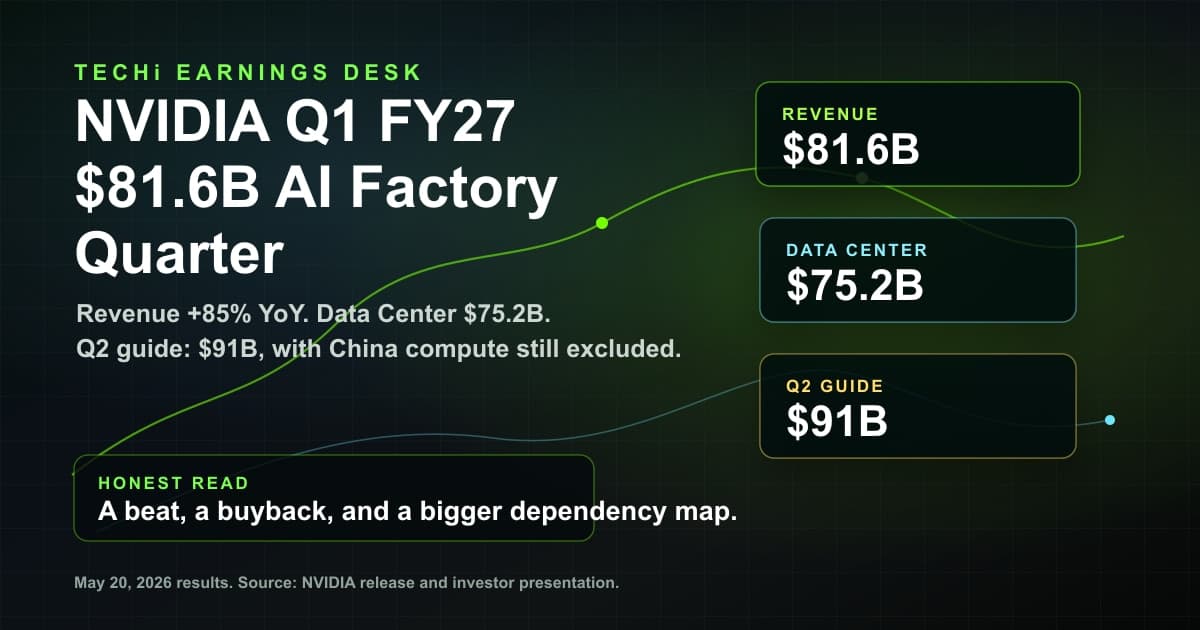
On February 25, 2026, Nvidia reported Q4 FY2026 revenue of $68.1 billion, up 20% quarter-over-quarter and 73% year-over-year. Data Center revenue hit a record $62.3 billion, per the company's earnings release. Non-GAAP EPS came in at $1.62, GAAP EPS at $1.76. The full-year FY26 totals ($215.9 billion in revenue, $4.77 non-GAAP EPS) represent the largest single-year absolute revenue increase by any US public company in history.
Jensen Huang's comment on the Q4 call is the line that matters for the Q1 FY27 setup: "Grace Blackwell with NVLink is the king of inference today, delivering an order-of-magnitude lower cost per token." Grace Blackwell is now shipping at volume. Vera Rubin, the next-generation platform, is on the annual cadence NVIDIA has committed to. See Tom's Hardware coverage of the AI accelerator arms race. The Q1 FY27 guide of $78.0 billion ±2% assumes Blackwell ramping at scale with zero Chinese data-center compute revenue. Any China thaw is pure upside to the guide.
The May 20 Earnings Preview
Nvidia reports Q1 FY2027 earnings on Wednesday, May 20, 2026, after market close, per Wall Street Horizon's earnings calendar. That's 33 days from this article's publication. The setup heading in: a $78 billion revenue guide with expected non-GAAP gross margin near 75%, Blackwell rack shipments accelerating through the quarter, and a market that has spent the last six weeks pricing inflation instead of earnings.
The realistic scenarios into the print:
- Beat and raise (most likely). Q1 prints at $80–82 billion, FY27 implied revenue climbs toward $340 billion, and the stock gaps to $215–$225 on the combination of earnings beat + multiple expansion from the macro tailwind.
- In-line print, maintained guide. Q1 at $77–79 billion, FY27 guide unchanged. Stock likely ranges $195–$210 as traders wait for the September Fed meeting for the next catalyst. This is the lowest-probability outcome, since NVDA has beaten revenue expectations in 22 of its last 24 quarters.
- Disappointing guide (low probability). A Q2 FY27 guide below $85 billion would be the first real crack in the Blackwell ramp story. Stock likely tests $180 support on a 10% pullback.
The risk/reward is asymmetric enough that even conservative PMs are starting to re-rate position sizes ahead of the print, which is part of why the $198 price hasn't cracked lower despite a broadly weak tech tape through Q1.
Where the Street Sits
Analyst coverage on NVDA is 43 strong, and the rating distribution is one of the most bullish in mega-cap US equities: 41 Buy, 1 Hold, 1 Sell. Per Stock Analysis analyst forecast data, the mean 12-month target sits at $273.57, implying 35.7% upside from the $201.68 Friday close (36.5% from the $198.35 Thursday anchor). The low target is $220 (implying NVDA remains roughly flat from here in the worst case), and the Street-high target of $380 implies 91% upside if every catalyst lines up.
What makes this consensus less of a cliché than it usually is: the analyst community updated price targets after the Q4 FY26 print on February 25 and before the oil crash and Fed-cut repricing of April 17. In other words, the $273 mean target bakes in the operational story but not the macro tailwind. If the 10-year yield moves 50 bps lower over the summer, those targets drift to $285–$295 on mechanics alone.
The Real Bear Case: Custom Silicon
The honest bear case against NVDA in 2026 is not an AI-bubble narrative. It is the hyperscaler custom silicon story. Google's TPU v7 (Ironwood) ships on TSMC 3nm with 4.6 PFLOPs of FP8 per chip and 192 GB HBM3e, in 9,216-chip optical-mesh pods. Microsoft's Maia 200 lands on TSMC 3nm with 140 billion transistors and 10+ PFLOPs FP4, with Microsoft publicly claiming 30% better perf/dollar than the prior generation. Amazon's Trainium 3 delivers 2.52 PFLOPs FP8 per chip in 144-chip liquid-cooled UltraServers. Meta's MTIA roadmap now includes four announced generations co-developed with Broadcom targeting 1+ gigawatts of deployment.
None of this kills the NVDA thesis. What it does is cap the multiple. Inference workloads at the hyperscaler tier (specifically, predictable high-volume inference where unit economics dominate) flow increasingly to custom silicon. Training workloads, complex agentic inference, and anything running outside the top five hyperscalers still flows to Nvidia. The result is that NVDA's forward P/E is structurally bounded in the 22–28x range rather than the 35–40x it traded at during the 2023–2024 peak. The stock can still double from here without the multiple needing to expand beyond where it sits today. But the ASIC story is the reason the 2026 thesis is a $300 target, not a $500 target.
The China Wild Card
The Q1 FY27 guide of $78 billion explicitly assumes zero data center compute revenue from China. The export-restriction regime is baked into consensus. That is a feature, not a bug, for the setup. Any incremental China revenue (through licensed H20 variants, a B20 export-compliance chip, or a rumored diplomatic thaw tied to the broader US-China trade framework) flows directly to the upside. A modest restoration to $5 billion per quarter of China data center revenue would add roughly $0.60 to annual non-GAAP EPS and support another $15–$20 of multiple-expansion-adjusted upside.
The downside case on China is already in the numbers. The upside case is call-option optionality. For broader context on how trade policy is reshaping tech valuations in 2026, see our AI stocks coverage.
How to Position for This Setup
The cleanest expression of the NVDA Fed-cut setup is direct: hold the stock into the May 20 earnings print and size to the conviction level appropriate for a single-stock concentration risk. For investors who prefer a wider exposure, the semiconductor ETFs (SMH, SOXX) capture roughly 18% NVDA weighting and diffuse the single-name risk at the cost of giving up some of the duration-sensitivity edge. Retail-oriented levered positions (NVDL, long options) are available but come with their own time decay and path-dependency costs that generally make them inferior to simply holding the stock through the 33-day window.
The key date calendar: April 30 (FOMC, no cut expected but the dot-plot language matters), May 13 (April CPI release, the first full month of post-Hormuz oil data feeding into headline inflation), May 20 (Nvidia Q1 FY27 earnings after close). If you are going to make a move on this setup, the window closes the afternoon of May 20. After that, the macro call-option becomes a fundamental call about FY27 execution, which is a different trade.
Bottom Line
NVIDIA at $201.68 (Friday's close) is quietly the best-positioned large-cap in the S&P 500 heading into summer 2026. The operational story is banked: $215.9 billion FY26 revenue, a $78 billion Q1 FY27 guide, Blackwell shipping, Vera Rubin on the annual cadence. The valuation story is cheap: 22x forward earnings is the lowest the stock has traded on forward since the AI rally began. The macro story is new: oil's crash has mechanically opened a cooling-inflation pathway that the 10-year Treasury hasn't fully priced yet, and NVDA is the cleanest duration beneficiary available. Analyst consensus sits at $273.57 with 41 of 43 analysts rating it Buy or Strong Buy. The May 20 earnings print is a binary risk that, based on 22 of the last 24 quarters, resolves positively more often than not.
This is not a trade that needs a thesis. It needs a clock. Thirty-three days to earnings. Six weeks to the next CPI read. Five months to a meaningful Fed repricing window. For a deeper structural view of why AI compute demand isn't ending soon, TECHi's full Nvidia pillar analysis has the long-form version of the bull case.
FAQ
Frequently asked questions
Why is NVIDIA a beneficiary of the oil crash?
NVIDIA is a second-order beneficiary of the April 17 oil crash through the duration channel. When oil crashes (Brent fell from $112 to $86.84 over two weeks), headline CPI expectations drop, which pulls 10-year Treasury yields lower over subsequent sessions, which mechanically lifts high-multiple growth stocks like NVDA. For a stock trading at ~22x forward earnings with 60-80% of DCF value in terminal value, a 25 bps yield drop translates to roughly 5-7% multiple expansion, or approximately $10-$14 on a $198 stock, with no change to earnings required.
What is NVIDIA's next earnings date?
Nvidia reports Q1 FY2027 earnings on Wednesday, May 20, 2026, after market close, per Wall Street Horizon's earnings calendar. Going into the print, management has guided to $78.0 billion in revenue (±2%) with non-GAAP gross margin near 75%. The guide explicitly assumes zero data center compute revenue from China, so any easing of export restrictions would be pure upside.
What is NVIDIA's analyst price target?
The mean 12-month Wall Street price target on NVDA is $273.57 based on 43 covering analysts, implying approximately 35.7% upside from the April 17, 2026 close of $201.68 (36.5% from the April 16 close of $198.35). The rating distribution is 41 Buy / 1 Hold / 1 Sell, one of the most bullish consensus ratings in the S&P 500. The low target is $220 and the Street-high target is $380.
Is custom silicon from Google and Amazon a threat to NVIDIA?
Yes, but the threat is bounded rather than existential. Google's TPU v7, Amazon's Trainium 3, Microsoft's Maia 200, and Meta's MTIA roadmap are all shipping or scaling in 2026. They are capturing share in predictable high-volume inference workloads at the hyperscaler tier. What flows to NVIDIA regardless: training, complex agentic inference, anything outside the top 5 hyperscalers, and essentially all enterprise AI. The net effect is a forward P/E multiple structurally bounded in the 22-28x range rather than the 35-40x peak of 2023-2024.
What does the Fed-cut setup mean for NVIDIA?
The post-oil-crash Fed-cut setup is a duration tailwind rather than a fundamental catalyst. As of April 17, 2026, Fed funds futures price only a 5% probability of a June 2026 cut but the path to a September cut has materially opened up with Brent at $86.84 and inflation expectations cooling. A further 46 bps drop in the 10-year Treasury yield over the summer, from 4.26% toward 3.80%, implies roughly 9-13% multiple expansion for NVDA on DCF mechanics alone, or approximately $18-$26 of upside on the current $201.68 price with zero change to earnings.
Is NVIDIA stock a buy ahead of May 20 earnings?
Analyst consensus is strongly positive with 41 of 43 covering analysts rating NVDA Buy or Strong Buy and a mean $273.57 12-month price target. NVDA has beaten revenue expectations in 22 of the last 24 quarters. The risk/reward into the May 20 print is asymmetric: a beat-and-raise scenario likely pushes the stock to $215-$225, while a disappointing Q2 FY27 guide could send it toward $180 support. This article is informational and is not a buy recommendation; always consult a licensed financial advisor before trading.
Disclaimer
This article is for informational purposes only and does not constitute financial, investment, tax, or legal advice. Market data, tax rules, and prices can change after the article date. TECHi and its authors may hold positions in securities or digital assets mentioned. Always conduct your own research and consult a licensed financial, tax, or legal professional before making decisions.
About the Author

CEO of TECHi. Building the operating system for serious tech investors. Previously led engineering at scale. Focus: AI capex thesis, semiconductor supply chain, and the equity tape.