



Bitcoin has gone from a shaky recovery to a full-blown momentum trade. At 8:14 p.m. UTC on September 21, CoinGecko showed BTC at $86,776, up 6.9% in 24 hours, with roughly $57.8 billion changing hands. Binance's BTC-USDT market had traded as high as $86,896. Minutes later, the price was pressing even closer to $87,000.
The speed matters as much as the level. Bitcoin spent last week fighting to reclaim $80,000, then cleared $82,000, $84,000 and $86,000 in quick succession. Our earlier report tracked the first leg, when Bitcoin briefly topped $84,000 and forced short sellers to cover. The latest leg looks broader, but it still carries the fingerprints of a squeeze.
So, is this a trap? Not yet. The breakout is real, spot demand has improved and the macro backdrop turned friendlier. But nearly vertical price action built partly on liquidations is vulnerable to a hard retest. For traders arriving late, the difference between a durable breakout and a bull trap now sits near $84,000.
- BreakoutBitcoin's jump toward $87,000 is a genuine breakout accelerated by forced short covering.
- DemandSpot buying improved and Friday's U.S. ETF inflow reached $433 million, but the full week was barely positive.
- RiskA negative Coinbase premium and rising leverage keep bull-trap risk alive.
- LevelThe decisive support is $84,000; breaking $80,579 would invalidate the breakout candle.
Why Bitcoin is pumping today
Four forces hit the market at once.
The first was a clean technical break. BTC pushed through the resistance band that had capped its recovery around $82,000 to $84,000. Once price moved above that area, sellers who had been leaning against the range lost their nearby invalidation point. Momentum traders entered, stop orders fired and market makers had to adjust rapidly.
The second force was mechanical: short liquidation. CoinGlass data cited across the market showed more than $750 million of crypto positions liquidated during the initial surge, including roughly $648 million of shorts. Later readings put total liquidations closer to $1 billion as Bitcoin extended above $86,000. Bitcoin alone accounted for hundreds of millions of dollars in forced exits.
A short liquidation is a buy order created by pain. A trader who borrowed exposure to bet on falling prices must buy back when an exchange closes the position. When many shorts share similar stop levels, those forced purchases can stack on genuine demand and turn a normal breakout into a fast vertical move.
That does not make the rally fake. It explains why the price covered several thousand dollars so quickly.
Spot demand finally joined the move
The most constructive evidence comes from spot trading. Glassnode's September 21 market pulse found that exchange taker flow had shifted from net selling to net buying as Bitcoin reclaimed $80,000. Volume rose, momentum turned positive and spot buyers helped start the advance before liquidations amplified it.
That is a better foundation than a futures-only spike. It suggests some buyers wanted Bitcoin at these prices instead of merely closing losing bearish positions.
U.S. spot Bitcoin exchange-traded funds also finished Friday with $433 million in net inflows, according to the daily fund data compiled by Farside Investors. Fidelity's FBTC supplied about $310.7 million and BlackRock's IBIT about $108.4 million.
There is an important catch: Friday's strong inflow rescued a weak week. The full September 14–18 period ended with only about $6.2 million of net inflows after large midweek withdrawals. One good session improved the tone, but it did not establish a sustained institutional buying streak.
Risk markets gave Bitcoin room to run
Bitcoin also caught a helpful macro wind. U.S. stocks rallied Monday as oil prices and bond yields eased. The S&P 500 gained 1.5%, while the technology-heavy Nasdaq Composite rose 2.3%, according to the Associated Press. Brent crude retreated toward $100 a barrel and the 10-year Treasury yield fell to 4.95%.
That combination matters because Bitcoin has often traded like a high-beta liquidity asset during large market moves. Lower oil pressure can soften inflation fears. Lower bond yields reduce the return available from safer assets. A strong Nasdaq session tells crypto traders that investors are willing to own risk again.
The macro backdrop did not create the short squeeze, but it removed a reason to fight it.
Corporate buying headlines added to the mood as well. Strategy and Strive disclosed Bitcoin purchases with a combined value of roughly $183 million. Those purchases were small relative to Bitcoin's daily turnover, yet they reinforced the idea that large balance-sheet buyers were still accumulating during volatility.
The strongest bull case
The bullish reading is straightforward: Bitcoin broke a multiweek ceiling with rising volume, positive spot taker flow and a risk-on macro session. It absorbed profit-taking, moved through several resistance levels and reached its highest price in roughly eight months.
The rally also repaired technical damage from the September selloff. BTC traded near $75,000 on September 15. Recovering more than $11,000 in less than a week changes positioning. Traders who sold the breakdown are trapped, while sidelined buyers face the fear of missing a larger recovery toward $90,000.
If Bitcoin holds above $86,000 after the liquidation wave cools, the next visible test sits around $88,000 to $90,000. A daily close in that zone, followed by a shallow retest, would show that the market has accepted higher prices rather than merely visiting them.
Why this could still become a bull trap
The warning is in the quality of U.S. demand. CryptoQuant's Coinbase Premium Index was around -0.02 while Bitcoin traded near $85,000. A negative reading means BTC was priced slightly lower on Coinbase than on offshore venues such as Binance. That can signal that U.S. spot buyers are not leading the rally.
The premium is not a perfect timing tool, and it can change quickly. Still, it conflicts with the cleanest bullish story. If large U.S. buyers were chasing the breakout aggressively, traders would prefer to see Coinbase command a premium.
Leverage is another risk. Glassnode reported futures open interest and funding above their recent high bands. Longs were paying more to hold positions as the rally progressed. That is normal during a breakout, but it creates fuel in both directions. If price stalls, crowded late longs can become the next forced sellers.
The 24-hour candle is extended too. Binance's market opened near $81,116, traded as low as $80,579 and then climbed toward $87,000. Buying after a 7% daily rise offers a much worse risk-reward profile than buying the reclaim of $82,000. A healthy market can correct several thousand dollars without breaking its larger setup.
The three levels that matter now
$86,000 is the immediate acceptance test. Holding above it after the first surge would show that buyers are willing to defend the breakout. Repeated failures back below the level would suggest the move ran ahead of spot demand.
$84,000 is the bull-trap line. It was resistance during the first stage of the squeeze and should now behave as support. A controlled retest followed by renewed buying would strengthen the case for $90,000. A fast loss would put the breakout under pressure.
$80,579 to $81,116 is the invalidation zone. Those figures mark Binance's 24-hour low and open for the session measured here. A drop through that region would erase most of the breakout candle and confirm that late buyers were trapped.
Between those levels, consolidation is more useful than another vertical spike. Sideways trading allows funding rates to cool, leverage to reset and spot demand to prove itself.
What would prove the move is durable
A durable rally needs evidence that remains after the squeeze ends.
First, watch whether the Coinbase premium turns positive and stays there. That would show U.S. spot demand joining offshore momentum. Second, monitor the next daily ETF flow prints. Friday's $433 million inflow is encouraging; several positive sessions would be much stronger evidence than one rebound day.
Third, price should hold the old resistance band on a retest. The clean bullish path is not necessarily a straight line to $90,000. It is a pullback that finds buyers above $84,000, followed by a close above the current high.
Finally, funding and open interest should cool without price collapsing. That would indicate leverage leaving the market while real holders keep their positions.
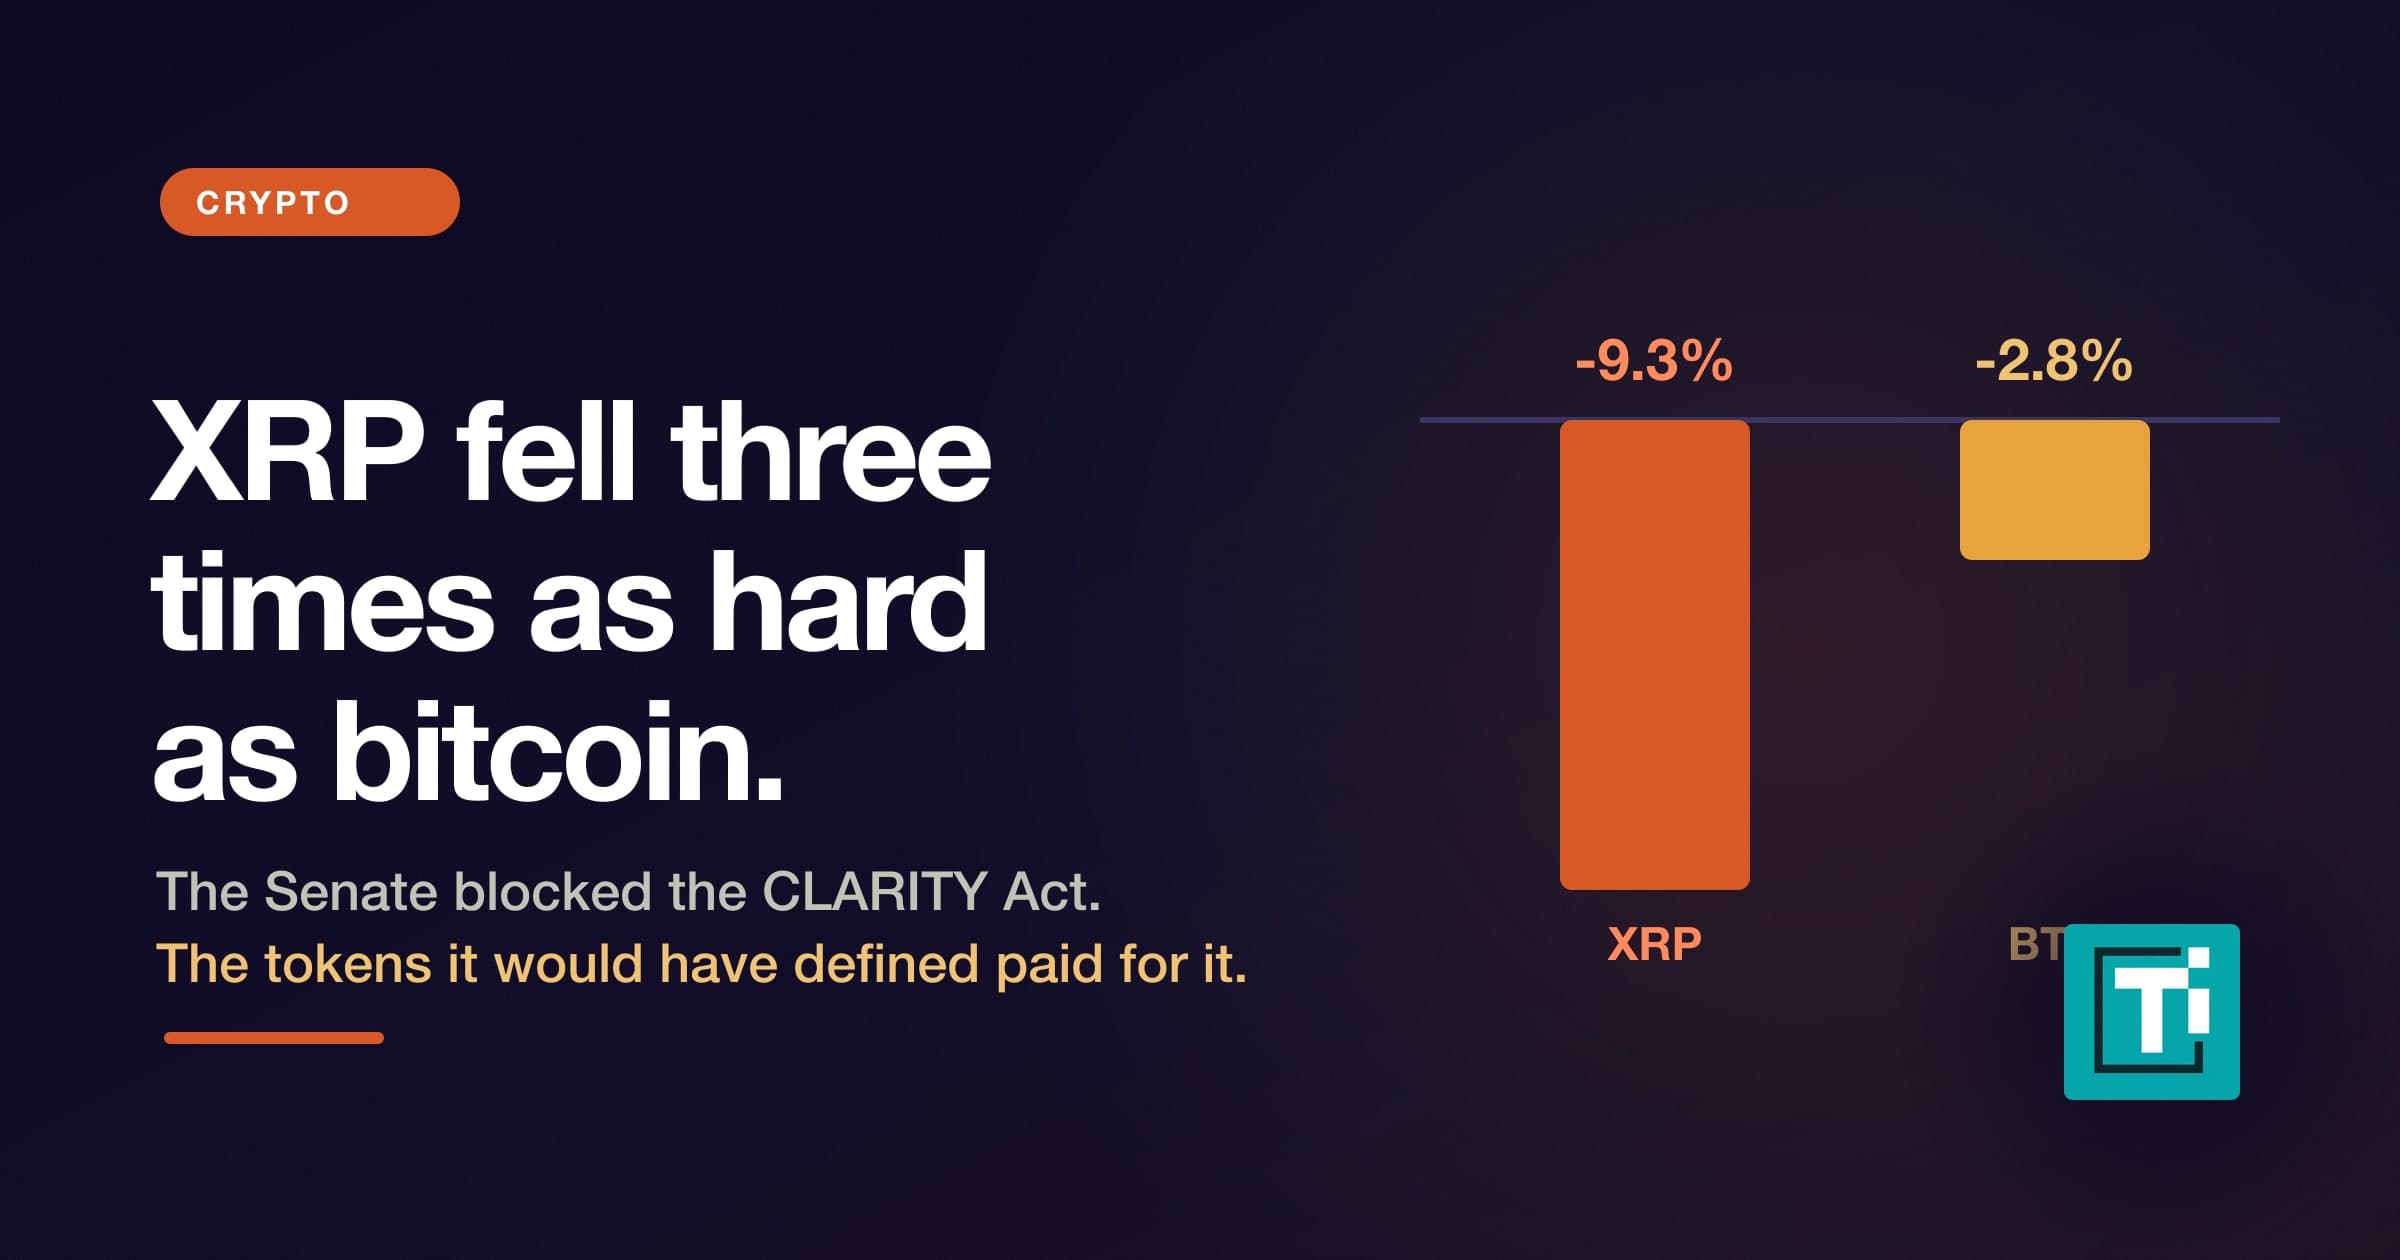
Readers comparing Bitcoin's momentum with the broader crypto complex should also watch whether capital spreads into other assets or remains concentrated in BTC. TECHi's recent coverage of the XRP selloff and regulatory risk shows how quickly token-specific catalysts can override a broad market rally.
TECHi verdict: breakout first, trap only if support fails
Bitcoin is pumping because a real spot-led recovery collided with crowded short positioning, stronger ETF demand on Friday and a friendlier day for global risk assets. Short covering made the rally faster, but it was not the only buyer in the market.
The trap risk comes from what has not confirmed yet: the Coinbase premium remains negative, weekly ETF flows were barely positive and leverage is rebuilding near the highs. Those weaknesses make a late chase dangerous even if the larger move survives.
For now, $84,000 separates a volatile breakout from a failed one. Holding that level keeps $88,000 to $90,000 in play. Losing it opens a retreat toward $82,000. A fall below the $80,579 session low would turn the bull-trap question into a much more convincing answer.
Bitcoin trades continuously, and prices can change sharply after publication. This analysis is informational and is not investment advice.
Image credit: Satheesh Sankaran, CC BY 2.0, via Wikimedia Commons. Cropped, color-graded and watermarked by TECHi.
FAQ
Frequently asked questions
Why is Bitcoin pumping today?
Bitcoin broke resistance around $82,000 to $84,000 as spot demand improved, global risk assets rallied and forced short liquidations accelerated the move.
Is the Bitcoin rally a bull trap?
It is not confirmed as a bull trap. Holding $84,000 supports the breakout, while a fast loss of that level and the $80,579 session low would signal failure.
What Bitcoin price confirms the breakout?
Sustained trading above $86,000 followed by a daily close and successful retest would strengthen the breakout. The next major zone is $88,000 to $90,000.
How much crypto was liquidated during the Bitcoin rally?
Early CoinGlass readings showed more than $750 million in 24-hour crypto liquidations, mostly shorts. Later reports placed the total near $1 billion as Bitcoin extended above $86,000.
Disclaimer
This article is for informational purposes only and does not constitute financial, investment, tax, or legal advice. Market data, tax rules, and prices can change after the article date. TECHi and its authors may hold positions in securities or digital assets mentioned. Always conduct your own research and consult a licensed financial, tax, or legal professional before making decisions.
About the Author

Muhammad Zeshan Sarwar is Editor-in-Chief of TECHi. His reporting follows balance sheets and blockchains: Oracle's $664 billion backlog and the stock sale that funds it, where Amazon's quarterly profit actually came from, NRG's PJM capacity revenue and the Zcash NU7 vote on future coin issuance.


Comments