- The patternNVDA has fallen on 4 of its last 5 earnings reports despite beating revenue estimates by 3 to 4 percent each quarter.
- Q1 consensusStreet is modeling $78.78B revenue and $1.76 adjusted EPS for Q1 FY27 — implying +78.8% year-over-year growth.
- The real numberQ2 FY27 consensus is $86.08B. The May 20 reaction hinges on whether NVDA guides above that, not on the Q1 print itself.
- Options pricingImplied move of roughly 5 percent maps to a $208 to $230 range by May 22 expiration — high end barely above the 30-day high, low end at last month's hyperscaler-earnings reaction low.
- Funding ceilingBig Four hyperscaler 2026 capex of ~$710B implies ~$112B per quarter for AI infrastructure. NVDA's $78.78B Q1 consensus is ~78% of that theoretical ceiling.
Editorial analysis, not investment advice. This piece uses publicly available sources to model earnings setup. It is not a recommendation to buy or sell any security. Earnings reactions are inherently uncertain; consensus estimates can revise sharply ahead of a report, and the implied move described is a derived figure from at-the-money straddle pricing observed in pre-earnings windows — not a forecast. Always do your own research and consult a licensed financial professional before trading earnings events.
NVIDIA beat consensus revenue every quarter of FY26 by 3 to 4 percent. The stock fell on four of those five prints. With Q1 FY27 due after the close on Wednesday, May 20, 2026, the consensus $78.78 billion revenue estimate is not the number that determines the trade. The Q2 guide is. Here is the math on why, and what it actually has to clear.
The pattern: five quarters of beating and falling
The headline result and the next-day price action have moved in opposite directions for most of the last 18 months. Each line below shows the report date, the result, and the next-day price reaction.
- Feb 26, 2025 — revenue beat — next-day −8.48%
- May 28, 2025 — revenue beat — next-day +3.25%
- Aug 27, 2025 — revenue beat — next-day −0.79%
- Nov 19, 2025 — revenue $57.01B vs. $54.87B consensus (+3.9% beat) — next-day −3.15%
- Feb 25, 2026 — revenue $68.13B vs. $65.90B consensus (+3.4% beat) — next-day −5.46%
Across that window: average absolute next-day move 4.23%, mean signed move −2.93%, hit rate on a positive earnings reaction 20% (1 of 5). Revenue and EPS verified against the Benzinga earnings dataset; next-day price moves cross-checked with OptionSlam's historical earnings table.
A 3 to 4 percent revenue beat has not been enough to clear the bar. The full price history sits on the NVDA quote page.
Why the Q1 print is the wrong focus
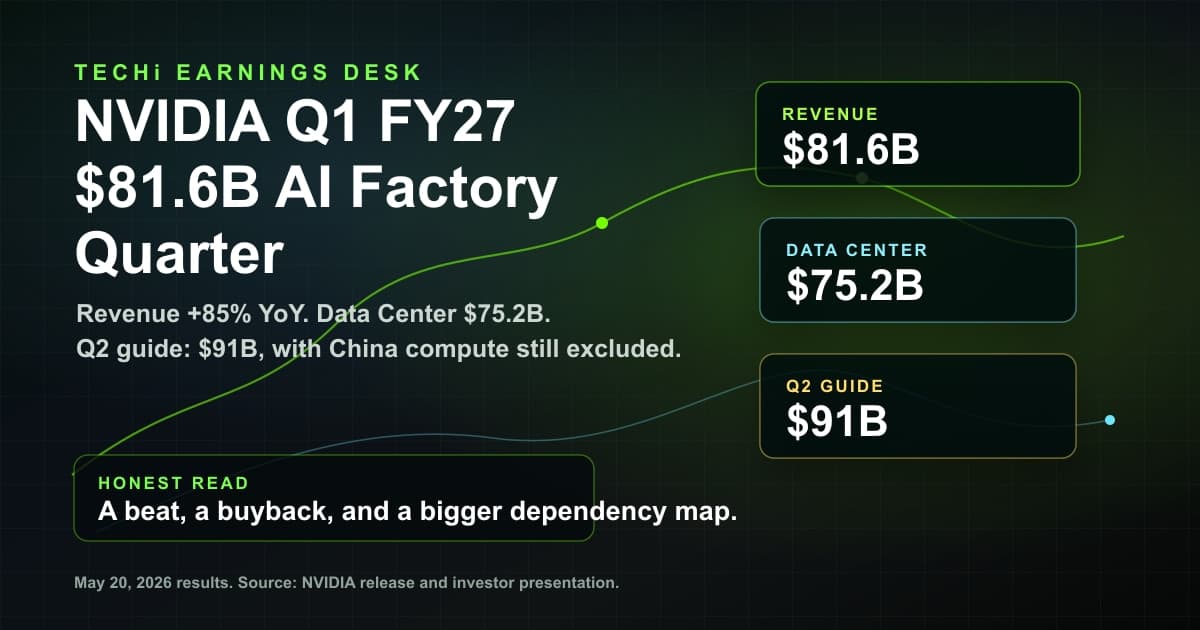
Consensus for Q1 FY27 (period ended April 26, 2026) is $78.78 billion in revenue and $1.76 adjusted EPS. Against the year-ago Q1 of $44.06 billion, that is +78.8 percent year-over-year growth. Strong on its own. But the next slot on the calendar — Q2 FY27 — is where the read-through lives.
Current Q2 consensus: $86.08 billion in revenue, $1.93 EPS. That implies +9.3 percent sequential growth on top of an already record Q1.
For reference, FY26 Q1-to-Q2 sequential growth was +6.1 percent ($44.06B to $46.74B). So the Street is already modeling sequential acceleration into Q2 FY27 — every dollar of guide below $86 billion reads as a deceleration versus the implicit assumption.
This is the asymmetry the headline number hides. A $1 billion Q1 beat is worth roughly nothing if Q2 guide lands at $84 billion.
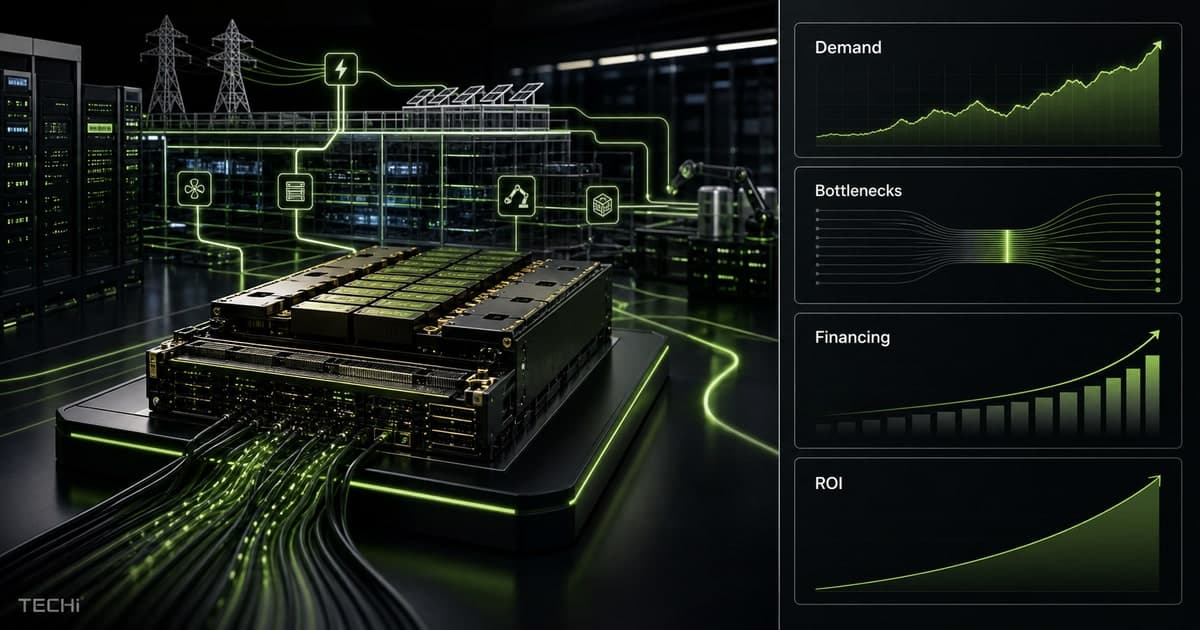
The hyperscaler funding ceiling and how tight it already is
The four largest US hyperscalers have laid out roughly $710 billion in combined 2026 capex based on their most recent earnings guidance: Amazon at about $200B, Microsoft at about $190B, Alphabet at about $185B, and Meta at about $135B (24/7 Wall St., May 1, 2026).
Roughly 75 percent of that — about $450 billion — flows to AI infrastructure: GPUs, accelerators, networking, racks, and power. Per-quarter run rate: about $112 billion.
NVIDIA captures an estimated 90 percent of AI accelerator demand per industry coverage of accelerator share. Theoretical NVDA share of one quarter of Big Four AI capex: about $101 billion.
NVIDIA's Q1 FY27 consensus of $78.78 billion is about 78 percent of that theoretical ceiling. The implication is sharp: NVDA is already monetizing close to the maximum quarterly AI capex outlay of the four largest customers in the world. The cushion to surprise on the demand-pull side is thinner than the year-over-year growth rate suggests.
If hyperscaler capex grows linearly into 2027 toward the projected $1 trillion mark (CNBC, April 30, 2026), the addressable quarterly pool expands to about $190 billion. That is a 2027 story, not a May 20 catalyst.
What the options market is pricing
NVIDIA's average historical earnings-day implied move has run in the 5 to 6 percent range based on at-the-money straddle pricing disclosed by Market Chameleon and OptionCharts in pre-earnings windows. The realized average over the last five reports — 4.23 percent absolute — has tracked just inside the implied. Options pricing has not been wrong, on average.
With NVDA closing at $219.44 on May 11, 2026 (verified via daily aggregate bars covering 28 sessions), a 5 percent implied move maps to a roughly $208 to $230 range by the May 22 expiration. The high end sits just above the 30-day high of $222.30; the low end coincides with the post-hyperscaler-earnings reaction low near $199 seen on April 30, 2026 (a −4.93 percent session on 225 million shares).
The options market is, in effect, pricing a coin flip between fresh all-time highs and a round-trip back to last month's lows.
The bar to actually break the pattern
Mapping the recent prints to what the market reacted to — not what was reported — the working levels for May 20 look like this.
- Q1 revenue: $80 billion or higher (a 1.5 percent beat or better) to satisfy the now-expected 3 to 4 percent beat cadence.
- Q1 adjusted EPS: $1.85 or higher versus the $1.76 consensus.
- Q2 revenue guide midpoint: $89 billion or higher. A guide of $86 billion (matching consensus) reads as soft on the recent pattern. A guide of $84 billion likely triggers another 3 to 5 percent post-earnings drop in line with the last two reports.
- Data center gross margin commentary: flat to up versus the Q4 FY26 reading. Any signal that Blackwell Ultra ramp costs are dragging margin would amplify a guide miss.
Anything below those levels likely resolves the implied move to the downside. The break-the-pattern outcome requires both a Q1 beat and a Q2 number above the $86.08 billion already in the Street model.
What this means for the trade
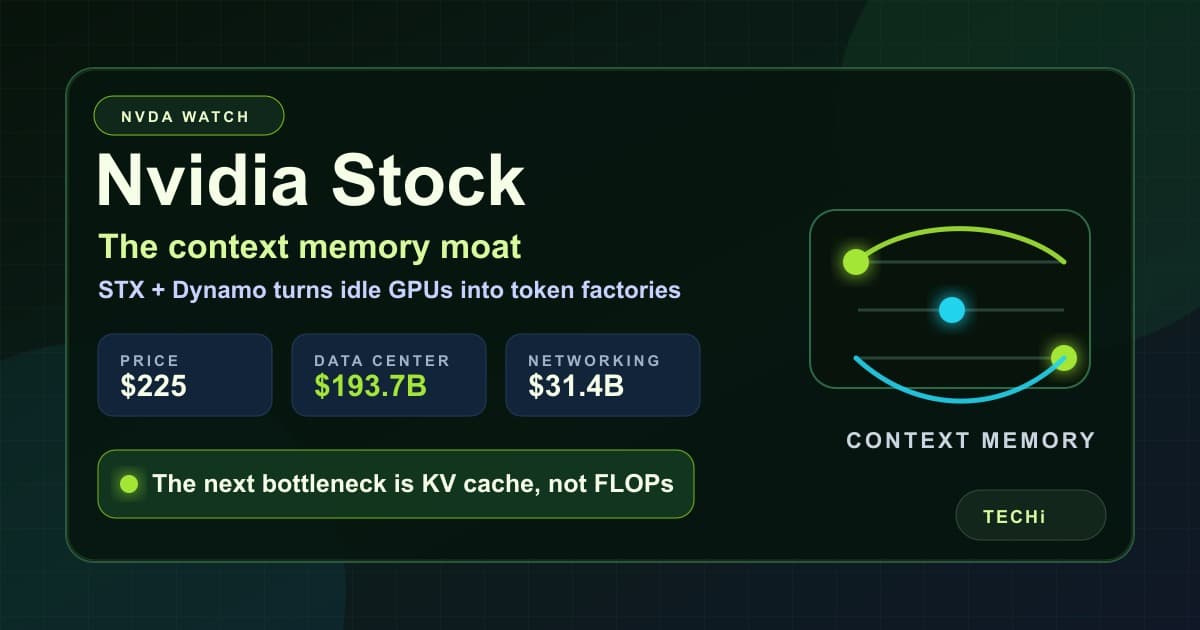
For a long-only investor, the question is whether the demand picture remains intact, not whether the next-day candle is green. On that front the answer is still yes. Trailing twelve-month data-center revenue of $193.7 billion (+75 percent year-over-year per NVIDIA's last annual report) plus hyperscaler 2026 capex at record levels make the multi-year thesis hard to break with a single soft guide.
For anyone trading the print itself, the recent history is unambiguous. A beat is necessary, not sufficient. The Street is paying for sequential acceleration. If the May 20 release does not deliver a Q2 guide north of consensus, the pattern of the last five quarters is the base rate, not the exception.
FAQ
Frequently asked questions
When does Nvidia report Q1 FY27 earnings?
Wednesday, May 20, 2026, after the market closes. The earnings call is at 5:00 p.m. ET / 2:00 p.m. PT.
What is the consensus estimate for NVDA Q1 FY27?
$78.78 billion in revenue and $1.76 in adjusted EPS, per the Benzinga earnings dataset compiled on April 29, 2026.
What is NVDA's implied earnings move for May 2026?
Historically around 5 to 6 percent based on at-the-money straddle pricing in pre-earnings windows. With NVDA closing at $219.44 on May 11, 2026, a 5% move maps to a roughly $208 to $230 range by the May 22 expiration.
Why does the Q2 guide matter more than the Q1 beat?
NVDA has fallen on 4 of its last 5 earnings prints despite beating revenue estimates by 3 to 4 percent each quarter. The Street is already modeling $86.08 billion for Q2 FY27. A guide below that level reads as deceleration; a guide above it is the only outcome that breaks the recent beat-and-fall pattern.
Disclaimer
This article is for informational purposes only and does not constitute financial, investment, tax, or legal advice. Market data, tax rules, and prices can change after the article date. TECHi and its authors may hold positions in securities or digital assets mentioned. Always conduct your own research and consult a licensed financial, tax, or legal professional before making decisions.
About the Author

Muhammad Zeshan Sarwar covers mobile technology, consumer electronics, and the intersection of crypto with mainstream products. He reviews phones and wearables against their shipping firmware rather than launch-day marketing, and tracks the crypto-in-app integrations Apple and Google actually allow on their platforms. His reporting spans hardware launches, iOS and Android ecosystem shifts, and the wallet and payments layer bridging both.