

Chip dies on a silicon wafer, photographed up close. Photo: Laura Ockel / Unsplash
The Philadelphia Semiconductor Index, the benchmark for U.S.-listed chipmakers, fell 3.83% on Friday, Oct. 16, and closed at 11,137.29. It was the eighth lower close in a row. TECHi counted the index's daily closes back to 1994: a losing run that long last happened in October 2008, and the index now sits 15.7% below its Oct. 6 close of 13,217.82.
The slide has also pushed the index 23.9% under its record close of 14,634.72 on June 22, past the 20% line many investors use to mark a bear market. It happened between two strong reports from the industry's largest names. ASML posted record quarterly sales on Oct. 14 and said its planned supply will not fully meet customer demand in 2027 or 2028. TSMC reported revenue up 50.9% from a year earlier on Oct. 15 and guided fourth-quarter revenue higher still. Their shares fell anyway.
- The streakEight straight lower closes, the longest run for the index since October 2008. A nine-session run last ended in May 2006.
- The spreadAll 23 chip and AI-hardware stocks TECHi tracked fell between Oct. 6 and Oct. 16, and 18 lost 10% or more. AI cloud, interconnect, equipment and memory names fell furthest.
- The backdropASML and TSMC reported strong numbers and the 10-year yield fell from 5.27% to 5.09% over the streak, so neither earnings nor rates explains the slide alone. Brent crude rose about 9%.
- The base rateAfter 15 earlier runs of seven sessions or more, the median 20-session change was −0.2%. Streak length has not told investors when the selling ends.
Eight sessions, 15.7% lost: how the chip index slid
The index closed lower on Oct. 7, 8, 9, 12, 13, 14, 15 and 16. Three days did most of the damage: a 4.30% drop on Oct. 14, 3.83% on Friday and 3.39% on Oct. 8. Friday was weak across the board. The Nasdaq Composite lost 2.15% to 26,140.03, the S&P 500 lost 1.09% to 7,659.44, and the Cboe Volatility Index closed at 19.99, up from 15.01 on Oct. 6.
The Nasdaq-100 fell 5.49% over the week, its worst weekly decline since the week that began March 31, 2025, when it lost 9.77%.

The index fell 15.7% from its Oct. 6 close across eight straight losing sessions. Source: Yahoo Finance daily closes; TECHi calculations.
Counting consecutive lower daily closes in Yahoo Finance's history for the index, which begins in May 1994, there have been 16 runs of seven sessions or more, this one included. Eight of them reached eight sessions. The last equal run went from Oct. 1 to Oct. 10, 2008, in the financial crisis. The last longer one, nine sessions, ended on May 18, 2006. Reports on Friday compared the streak with both years, and the closes explain why: 2008 is the last time it was this long, and 2006 is the last time it was longer.
In size, the 15.7% decline ranks fourth among those 16 runs. The September 2002 run cost the index 21.7%, the October 2008 run 19.8% and a nine-session run in July 1996 17.7%.
Which chip stocks fell the most?
TECHi tracked 23 large chip and AI-hardware stocks from the Oct. 6 close to Friday's close, plus two AI cloud operators that trade alongside them. All 23 chip stocks fell. Eighteen lost at least 10% and nine lost at least 20%. The simple average decline was 16.3%, close to the index's own 15.7%.
| Group | Stocks | Average move | Range |
|---|---|---|---|
| AI cloud operators (not in the index) | CoreWeave, Nebius | −33.4% | −33.8% to −33.1% |
| Interconnect and networking | Astera Labs, Credo, Marvell | −23.5% | −26.7% to −20.6% |
| Memory | Micron, SK hynix (ADR) | −20.6% | −25.2% to −15.9% |
| Chip equipment | Applied Materials, ASML, KLA, Lam Research, Teradyne | −19.0% | −24.5% to −10.5% |
| Processors and foundry | AMD, Arm, Broadcom, Intel, Nvidia, Qualcomm, TSMC (ADR) | −15.1% | −24.7% to −4.9% |
| Analog and power | Analog Devices, Microchip, Monolithic Power, NXP, onsemi, Texas Instruments | −10.4% | −17.8% to −6.0% |
TECHi's reading of the ranking is that the further a company's revenue depends on the next wave of data-center construction, the more its stock fell. CoreWeave and Nebius, which borrow to build computing capacity, lost about a third of their value. Astera Labs, Credo and Marvell, which sell connectivity inside AI clusters, lost 21% to 27%. Equipment makers followed: Teradyne fell 24.5%, Applied Materials 22.8% and Lam Research 21.0%. Memory was close behind, with SK hynix down 25.2% and Micron down 15.9%. Analog and power chips fell least, led by Analog Devices at 6.0% and NXP at 6.2%.
Nvidia fell 10.5%, a smaller drop than the index. Arm fell 24.7% and Intel 20.1%.

Price change from the Oct. 6 close to the Oct. 16 close. Source: Yahoo Finance daily closes; TECHi calculations and groupings.
Outside tech the same window looked different. The Invesco QQQ fund, which tracks the Nasdaq-100, fell 6.6% between Oct. 6 and Oct. 16. The Energy Select Sector fund rose 7.0%, the Consumer Staples Select Sector fund rose 7.1% and Apple gained 2.9%.
Why are chip stocks falling? Four facts that do not line up
The record holds no single catalyst. Four dated facts bear on the sell-off, and none explains it alone.
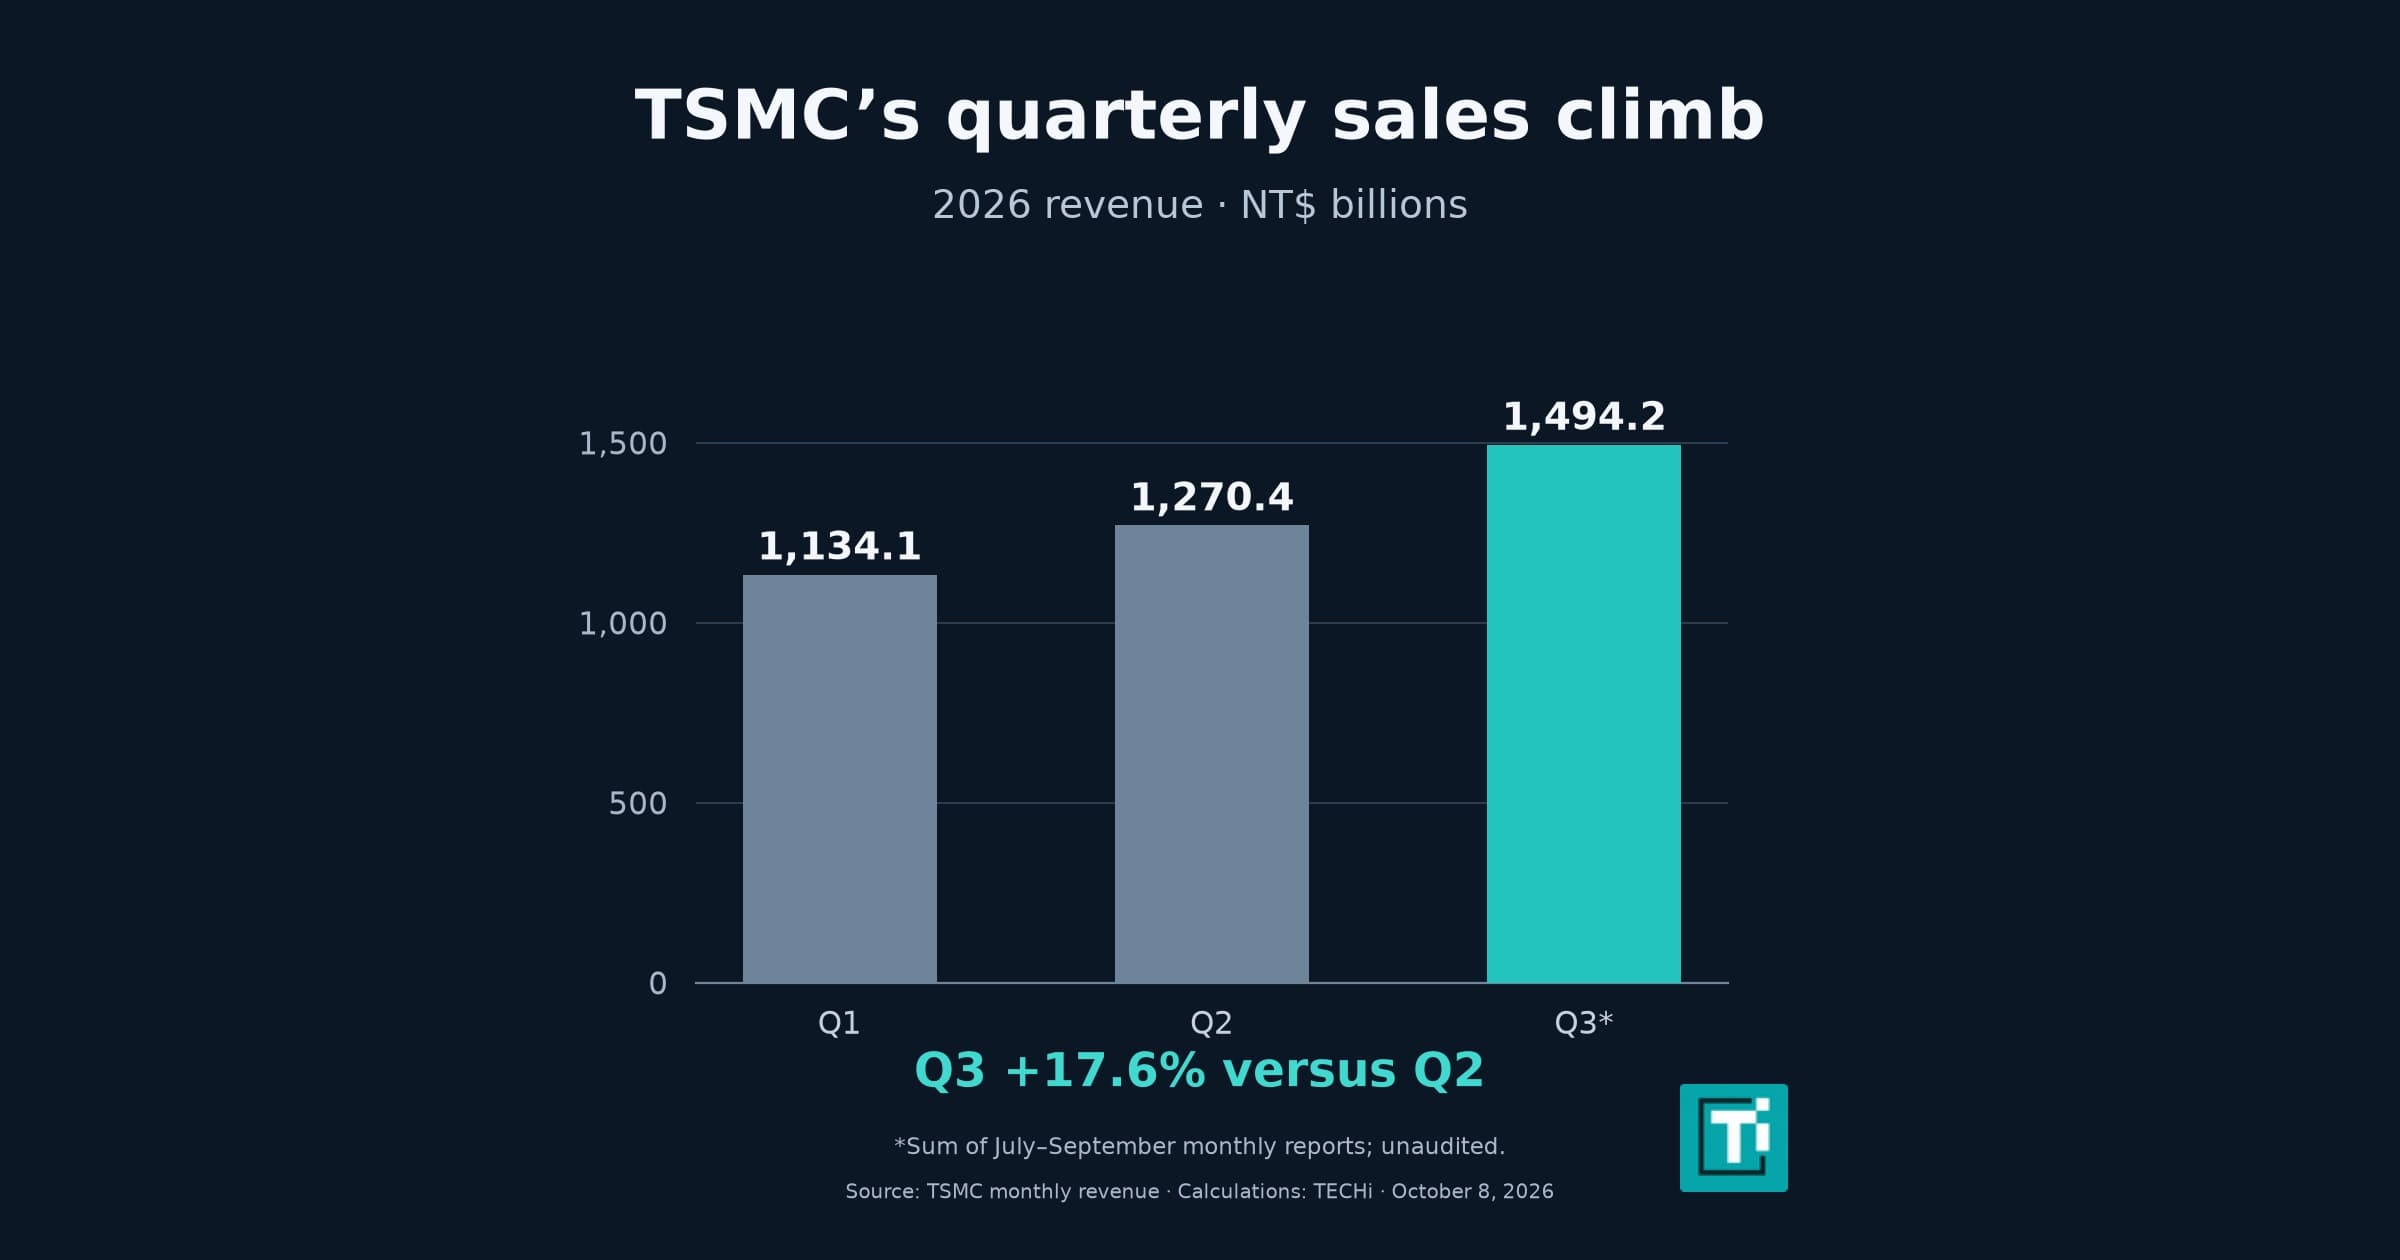
The chip reports were strong. ASML's Oct. 14 release reported record quarterly sales of €11.7 billion, a 57.5% gross margin and fourth-quarter sales guidance of €14.2 billion to €15.2 billion. Its chief executive said supply as currently planned for 2027 and 2028 will not fully meet customer demand. The stock still fell 3.94% that day, and the index fell 4.30%. TSMC followed on Oct. 15 with third-quarter revenue of NT$1,494.24 billion and a fourth-quarter outlook of US$52.3 billion to US$54.3 billion, against the US$46.72 billion it had just reported. Its U.S.-listed shares fell 1.80% that day and 2.28% on Friday.
Treasury yields fell, not rose. The Treasury's par yield curve put the 10-year at 5.27% on Oct. 6 and 5.09% on Oct. 16. The 2-year went from 4.79% to 4.74%. A 10-year yield near 5% leaves little room for stocks priced on distant profits, but over this stretch the yield fell while chips fell with it.
Prices and oil rose. The Bureau of Labor Statistics reported on Oct. 14 that consumer prices rose 0.6% in September and 3.7% over twelve months, up from 3.4% in August. Gasoline's 9.1% jump supplied more than half of the monthly rise, and prices excluding food and energy rose 0.3%. Brent crude futures ended the week at $109.69, 9.1% above their Oct. 6 level and their highest close since May 19, while U.S. crude rose 10.7% to $99.04. The CPI report and ASML's results landed the same morning, so the Oct. 14 drop cannot be assigned to either one.
The financing story fits the shape of the sell-off best. CoreWeave and Nebius fell 11.9% and 12.2% on Friday alone. TECHi covered the debt-market side of those moves in its reports on CoreWeave's shares and bonds and on the customer-funded buildout at Nebius. Companies that must keep borrowing to build capacity feel any hesitation from lenders first, and their suppliers in equipment, memory and interconnect are next in line. That is a reading of the ranking above, not a finding about any lender's behavior. TECHi did not find a report that isolates one cause, and the data cannot separate them.
What happened after earlier chip streaks like this?
A run this long invites the expectation of a bounce. TECHi checked it against the index's own history. Of the earlier runs that reached eight sessions or more, none was followed by a consistent recovery.
| Run (first to last losing close) | Sessions | Index decline in the run | Five sessions later | Twenty sessions later |
|---|---|---|---|---|
| Jul. 2–15, 1996 | 9 | −17.7% | +0.9% | +15.3% |
| May 17–29, 2002 | 8 | −11.5% | −2.5% | −20.3% |
| Sept. 12–23, 2002 | 8 | −21.7% | +0.9% | +19.5% |
| May 8–18, 2006 | 9 | −10.3% | −2.4% | −4.4% |
| Jun. 2–13, 2006 | 8 | −8.8% | +2.9% | −3.8% |
| Dec. 27, 2007–Jan. 8, 2008 | 8 | −13.6% | −2.4% | −4.1% |
| Oct. 1–10, 2008 | 8 | −19.8% | −2.8% | −9.3% |
Two of the seven runs were higher twenty sessions later, both by more than 15%. Five were lower, including the May 2002 run, which kept falling another 20%. Widening the sample to all 15 earlier runs of seven sessions or more, the median five-session change was −0.4% and the median 20-session change −0.2%. Six of the 15 were higher after five sessions and seven were higher after twenty.
Streak length, in other words, has not worked as a timing signal. The sample is small, the episodes come from very different markets, and the index history used here is price-only. None of it is a forecast.
What would change the read
The strongest case against a deeper break sits in the filings. Demand evidence from ASML and TSMC is intact, and an index that has lost 15.7% in eight sessions on a financing scare can recover quickly if lenders steady. The evidence on the other side would be the AI cloud stocks sliding further, which would show the pressure moving from share prices to funding.
Two dates will test it. Lam Research reports its September quarter on Wednesday, Oct. 21, with its call set for 2 p.m. Pacific. Equipment stocks fell 19% on average in this sell-off, so a second equipment maker repeating ASML's demand message would show whether the drop reflects fear or fundamentals. The Federal Reserve meets on Oct. 27 and 28, its first meeting since the 3.7% inflation reading. U.S. markets reopen on Monday, Oct. 19, with the semiconductor index 15.7% below where the streak began.

Disclaimer
This article is for informational purposes only and does not constitute financial, investment, tax, or legal advice. Market data, tax rules, and prices can change after the article date. TECHi and its authors may hold positions in securities or digital assets mentioned. Always conduct your own research and consult a licensed financial, tax, or legal professional before making decisions.
About the Author

Umair Aslam is a finance executive and markets writer at TECHi. He completed INSEAD's Management Acceleration Leadership Program in executive education in 2025. His published analysis covers public companies, AI infrastructure and semiconductors, including earnings, financing requirements, valuations and stock comparisons.


Comments