



A Tesla Cybercab can be moving, carrying a paying passenger and adding to the company’s cumulative Robotaxi mileage while still destroying the economics investors expect from autonomy.
That is the uncomfortable lesson in a recent Austin ride. A passenger reported that a trip of roughly six miles took 70 minutes after the vehicle followed a long surface-street detour. The episode is anecdotal, and it does not establish a fleet-wide failure rate. It does expose a measurement problem, though: paid miles are not the same thing as productive hours.
Tesla’s quarterly materials emphasize cumulative paid Robotaxi miles. The company showed about 2.4 million of them through June, after roughly 1.7 million through March. Miles prove that the service exists and that customers are riding. They do not reveal whether each vehicle is earning enough revenue per hour to justify manufacturing, charging, cleaning, maintenance, insurance, remote support and depreciation.
For TSLA investors, the next useful Robotaxi chart should measure time.
- The missing metricTesla reports cumulative paid Robotaxi miles, but not passenger minutes, empty miles or completed trips per vehicle-day.
- Why time mattersA detour can add paid miles while reducing the number of fares a Cybercab can complete in an hour.
- Valuation pressureAt a roughly $1.44 trillion market value, TSLA needs fleet economics that justify more than technical operation.
- What to watchProductive vehicle-hours, route efficiency, pickup time, remote interventions and contribution margin would reveal the commercial quality of the network.
The mile counter flatters a detour
Miles work well as an engineering milestone. They establish operating experience and create data for training and safety analysis. They are a weaker measure of a transportation business.
Consider two hypothetical paid trips that each cover six miles. One takes 15 minutes and the other takes 70. Both add six paid miles to a cumulative chart. The first vehicle can return to the network and accept another fare. The second remains occupied for nearly five times as long, even before accounting for the distance and time spent reaching the passenger.
Axios reported a more ordinary Cybercab round trip in Austin this week: pickups took five minutes or less and each four-mile leg cost about $12. The vehicle nevertheless stopped at an adjacent restaurant rather than the requested destination, creating a modest inconvenience for that passenger and a potentially larger accessibility problem for someone unable to walk the remaining distance. The same report cited the separate 70-minute detour.
These examples should not be treated as a statistically representative sample. They are useful because they show what Tesla’s current public metric cannot distinguish. A mile counter records motion. It does not record whether the route was competitive, the pickup was correct or the asset could earn another fare quickly.
That distinction matters more for a purpose-built two-seat Cybercab than it does for a privately owned car. A fleet vehicle is a small factory on wheels. Its scarce input is not mileage. It is sellable time.
Productive vehicle-hours are the real denominator
The basic Robotaxi equation is simple:
Revenue per productive vehicle-hour = fares collected ÷ time the vehicle is available and serving the network.
A serious unit-economics dashboard would break that denominator into at least five pieces:
- Passenger time, when a rider is in the vehicle and revenue is being earned.
- Pickup time and empty distance, often called deadhead operation.
- Charging and cleaning time.
- Maintenance or repair downtime.
- Time lost to remote assistance, blocked routes or operational restrictions.
Tesla discloses none of those fleet-level inputs in its quarterly shareholder materials. It also does not disclose paid trips, average fare, completed-trip rate, intervention frequency or contribution margin for Robotaxi. The absence is understandable for an early service. It becomes harder to ignore when autonomy carries so much of Tesla’s equity story.
The company’s Q2 2026 filing says it expects capital expenditure above $25 billion this year, driven partly by AI infrastructure and a growing fleet of company-operated, AI-enabled assets. The same filing shows quarterly R&D expense rising 49% from a year earlier. Investors are already funding the buildout. They should eventually be able to see the operational yield.
Why route constraints hit margins twice
A route limitation hurts a fleet in two places.
The obvious cost is time. If a vehicle avoids a highway or cannot use a certain entrance, a ten-minute trip can become a long surface-street journey. The passenger may pay more, cancel or choose another service next time. Even when the fare covers the extra distance, the vehicle loses the chance to complete another trip during the same hour.
The second cost is network imbalance. Long detours can leave cars in places where the next pickup is less likely, forcing additional empty travel. A fleet operator can reposition vehicles, but repositioning consumes electricity, tires and asset time without generating a fare.
This is why paid miles per vehicle can rise while profit per vehicle-hour falls. Higher mileage may even accompany weaker economics if routing restrictions cause cars to travel farther for the same origin and destination.
Tesla has an important potential advantage here. Its vertical integration could lower vehicle acquisition cost, and a purpose-built Cybercab should use fewer parts than a conventional ride-hailing car. Tesla also controls the app, charging network, vehicle software and much of the manufacturing stack. Those advantages can make a mediocre route more tolerable. They cannot make time free.
The valuation gap is now measurable
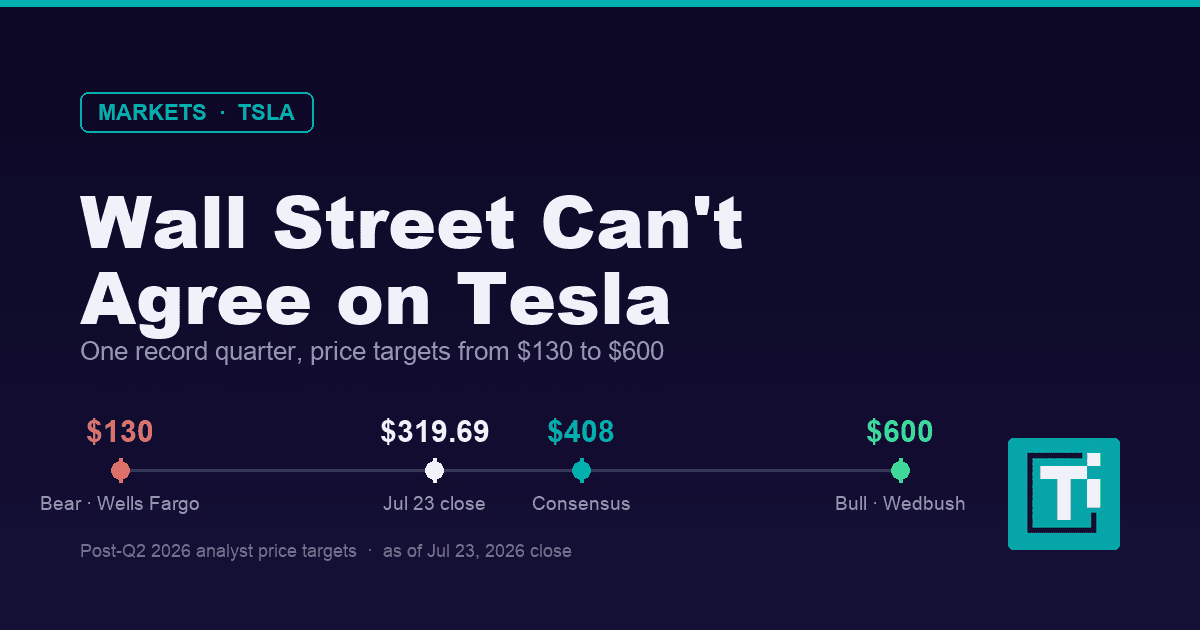
On TECHi’s TSLA quote page, Tesla closed Friday at $364.27, giving it a market capitalization of about $1.44 trillion. The stock traded at roughly 334 times trailing earnings and 78 times forward earnings, while the company’s latest quarterly automotive gross margin was 16.9%.
Those figures do not mean TSLA must fall. They show how much future profit the price already anticipates. Tesla does not need Robotaxi merely to operate. It needs the service to produce software-like returns on a capital-intensive physical fleet.
The most generous bull case assumes three things happen together: Cybercab manufacturing cost declines, autonomous driving handles a wider operating domain and vehicle utilization rises. The first reduces invested capital per car. The second makes more trips addressable. The third spreads fixed costs across more fares.
Productive hours connect all three. A cheaper Cybercab that spends much of the day charging, waiting or taking inefficient routes is not a high-return asset. A technically impressive vehicle that cannot serve common highway journeys leaves revenue on the table. A dense fleet with too many empty pickup miles can create the appearance of scale without the economics of scale.
TECHi’s earlier analysis of vehicles per square mile addressed whether Tesla can put enough cars near demand. The next layer is harder: what each nearby car does with its hour once a rider taps “book.”
The disclosure gap also makes quarter-to-quarter comparisons difficult. A larger fleet should produce more total miles almost automatically. Productive hours would show whether Tesla is improving the revenue yield of each deployed Cybercab as the network grows—a much tougher test, and a much more relevant one for shareholders underwriting years of autonomy investment.
What Tesla should disclose next
Tesla does not need to reveal commercially sensitive route maps or city-level pricing algorithms. A compact quarterly set of fleet indicators would give investors far more information than another cumulative curve.
A useful disclosure could include:
- Paid trips and paid miles for the quarter, rather than only cumulative miles.
- Passenger minutes as a percentage of total available vehicle minutes.
- Median pickup time and median trip-time variance versus a conventional route estimate.
- Empty miles as a percentage of total fleet miles.
- Completed trips per active vehicle-day.
- Remote-assistance events per 1,000 trips.
- Fleet contribution margin before corporate R&D.
Safety belongs beside these numbers, not beneath them. Tesla’s own FSD safety methodology explains how it classifies collisions around FSD engagement. A commercial Robotaxi report needs an equally clear definition of unsupervised miles, interventions and incidents. NHTSA’s Cybercab self-certification inquiry adds another reason for precise reporting as regulators examine how a vehicle without traditional controls fits existing federal standards.
A company cannot optimize what outsiders cannot measure, but investors can demand better denominators.
The Austin detour is a warning, not a verdict
It would be careless to build a bearish Tesla thesis around one bad ride. Early networks improve. Geofences expand, highway capability can arrive, maps change and dispatch algorithms learn. Waymo and other autonomous operators have also faced blocked roads, awkward stops and emergency-response problems.
The lesson is narrower and more useful. Tesla’s chosen headline metric is too forgiving. Cumulative paid miles always move up. It is a total that cannot decline, even when growth slows or trips become less efficient. Productive vehicle-hours can deteriorate, and that is exactly why the metric would be informative.
The bullish outcome is easy to describe. Tesla widens Cybercab’s operating domain, increases direct-route completion, keeps pickups short and turns each low-cost vehicle into a high-frequency revenue asset. If that happens, fares per productive hour should rise while support and downtime fall.
The bearish outcome is subtler than “Robotaxi does not work.” The service can work, attract riders and accumulate millions of miles while failing to earn an adequate return on each deployed vehicle. At Tesla’s valuation, partial technical success may not be enough.
For the next earnings cycle, investors should watch the TSLA earnings calendar and listen for operating-domain expansion, fleet size and Cybercab production. The sharper question is the one management has not yet answered: how many dollars of fare revenue does one Cybercab generate for every hour Tesla owns it?
Until that number appears, paid miles tell us that the wheels are turning. They do not tell us whether the economics are moving forward.
FAQ
Frequently asked questions
What Robotaxi metric does Tesla currently report?
Tesla has emphasized cumulative paid Robotaxi miles. That shows operating experience, but it does not reveal fares per hour, empty miles, downtime or trips per vehicle.
Why are productive vehicle-hours important for TSLA investors?
Productive vehicle-hours connect fare revenue with the time and capital Tesla commits to each fleet vehicle. They help show whether more miles translate into attractive unit economics.
Does one 70-minute Cybercab trip prove Tesla Robotaxi is failing?
No. One ride is anecdotal and cannot represent the whole fleet. It illustrates why cumulative miles alone cannot distinguish efficient trips from costly detours.
What should Tesla disclose about Robotaxi economics?
Useful indicators include quarterly paid trips, passenger minutes, empty-mile share, completed trips per vehicle-day, remote-assistance events and fleet contribution margin.
Disclaimer
This article is for informational purposes only and does not constitute financial, investment, tax, or legal advice. Market data, tax rules, and prices can change after the article date. TECHi and its authors may hold positions in securities or digital assets mentioned. Always conduct your own research and consult a licensed financial, tax, or legal professional before making decisions.
About the Author

Omer Sheikh covers Tesla and SpaceX as public-market stories, from the federal audit of Cybercab's safety certification to how much more SpaceX now spends on AI than on rockets. He also follows the capital moving through AI, including Nvidia's reported talks to anchor Anthropic's IPO and Intel's $15 billion request to investors.



Comments