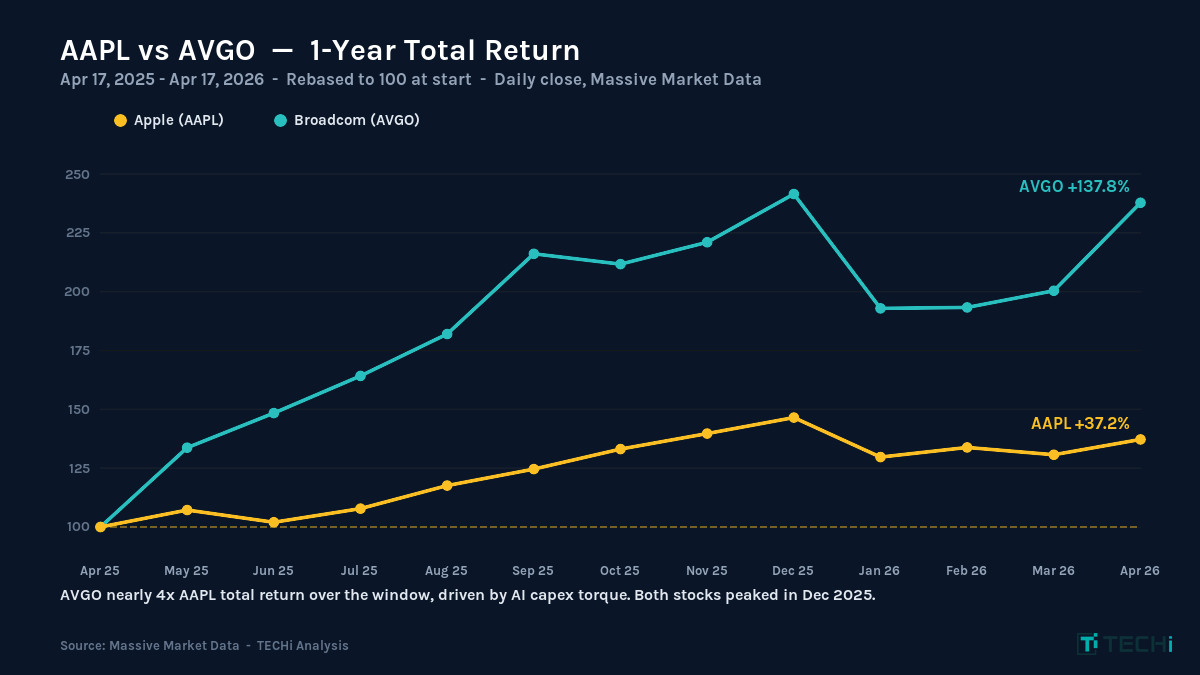
- Price SnapshotAAPL at $270.42 vs AVGO at $405.69 as of April 17, 2026 close. Both have more than doubled from April 2025 lows as AI capex kept flowing through the March drawdown.
- Dividend YieldAAPL ~0.4% ($1.04 annual) vs AVGO ~0.6% ($2.60 annual). Both are growth stories, not current-income stories.
- Dividend GrowthApple's payout has grown ~100% over the past decade; Broadcom's has grown ~1,200%. 7% CAGR vs 29% CAGR.
- AI ExposureBroadcom reports $8.4B in Q1 FY2026 AI revenue (+106% YoY) and targets $100B by 2027. Apple does not disclose a separate AI revenue line.
- The VerdictApple for capital preservation and buyback-driven EPS growth. Broadcom for dividend compounding and direct AI torque. Most tech portfolios should hold both.
Apple and Broadcom are the two largest tech stocks most dividend investors own, and they are playing almost entirely different games. Apple is the cash flow fortress: $143.8 billion in Q1 FY2026 revenue, a 2.5-billion-device installed base, and a dividend that compounds like a metronome. Broadcom is the AI torque play: $8.4 billion in quarterly AI chip revenue growing 106 percent year-over-year, a 15-year streak of dividend hikes, and a management team guiding the market to a $100 billion AI revenue line by 2027. Both pay dividends. Both ride the semiconductor supercycle. But the math for 2026 and beyond tilts sharply one direction depending on whether you want capital preservation or capital multiplication.
Market snapshot (April 17, 2026): Apple (AAPL) closed at $270.23, roughly 6 percent below its December 2025 all-time high of $288.62. Broadcom (AVGO) closed at $406.54, about 2 percent off its December 2025 peak of $414.61. Both stocks have more than doubled from their April 2025 lows ($189.81 and $161.61 respectively) as the AI capex cycle kept spending intact through the March 2026 market drawdown. The Technology Select Sector SPDR Fund (XLK) closed at $154.35, and hyperscaler 2026 capital expenditure guidance still points to $630-700 billion in AI infrastructure investment. That is the demand tailwind that benefits both companies, though Broadcom captures far more of it directly than Apple does.
The Two Businesses at a Glance
Before diving into the individual stories, it helps to see both businesses side-by-side. The numbers reveal why these two stocks sit in different portfolio buckets despite both being sub-1 percent yielders in the Magnificent Seven orbit.
Metric | Apple (AAPL) | Broadcom (AVGO) |
|---|---|---|
Closing Price (Apr 17, 2026) | $270.23 | $406.54 |
52-Week Range | $189.81 – $288.62 | $161.61 – $414.61 |
Market Cap | ~$4.05T | ~$1.91T |
Forward P/E | ~31x | ~32x |
Quarterly Dividend | $0.26 | $0.65 |
Annual Dividend | $1.04 | $2.60 |
Dividend Yield | ~0.4% | ~0.6% |
Consecutive Years of Hikes | 15 | 15 |
10-Year Dividend CAGR | ~7% | ~29% |
Most Recent Quarter Revenue | $143.8B (Q1 FY2026) | $19.31B (Q1 FY2026) |
YoY Revenue Growth | +16% | +29% |
AI Revenue Line | No direct disclosure | $8.4B (Q1, +106% YoY) |
Annual FCF (TTM) | ~$100B | ~$27B |
Apple is more than twice Broadcom's size by market capitalization. Broadcom is growing AI revenue at triple-digit rates, while Apple does not disclose a separate AI revenue line at all. Both have lifted their dividends for 15 straight years, but the compounding trajectory is radically different: Broadcom's payout has grown roughly 1,200 percent over the past decade versus Apple's 100 percent. That single data point explains more about these two stocks than any valuation debate.
Apple (AAPL), The Cash Flow Fortress
Apple is the largest company in the world by market capitalization, and the scale of its earnings power is what defines the dividend thesis. The company's Q1 FY2026 results (the December 2025 quarter) were the strongest in Apple's history: $143.8 billion in revenue, up 16 percent year-over-year, with diluted EPS of $2.84, up 19 percent. iPhone hit all-time records across every geographic segment, Services crossed $30 billion in quarterly revenue for the first time, and China returned to growth after three quarters of declines. Net income for the quarter was $42.1 billion. Twelve-week net income.
The Revenue Engine: iPhone Plus Services Plus Installed Base
Apple's business model is deceptively simple. The iPhone is still the anchor, accounting for roughly half of total revenue in any given quarter. The iPhone 17 cycle, with its thinner chassis, expanded Apple Intelligence features, and meaningful China performance, drove the record Q1 print. But the more important story is Services, which grew 14 percent year-over-year to $30 billion and now runs at roughly 75 percent gross margin. The App Store, iCloud, Apple Music, Apple TV+, AppleCare, and advertising collectively make Apple the world's largest enterprise software business disguised as a consumer hardware company.
The installed base is the deep moat nobody can copy. Apple now has more than 2.5 billion active devices in use globally. Every iPhone sold creates a seven-to-ten year monetization runway through Services, accessories, and upgrades. When analysts model Apple, they are not modeling a hardware business. They are modeling a recurring subscription franchise with a Trojan-horse phone attached to it.
The Dividend and Buyback Machine
Apple declared a $0.26 per share quarterly dividend in early 2026, up from $0.25 the prior year, marking the 15th consecutive annual increase. Annualized that is $1.04 per share, which at a $270.23 closing price produces a dividend yield of roughly 0.4 percent. The payout ratio is about 13 percent of GAAP earnings, one of the lowest in the S&P 500 for any company that pays a dividend at all.
The dividend is not where Apple returns the bulk of its capital. Buybacks are. Apple has repurchased more than $700 billion of its own stock since initiating the program in 2012, shrinking the share count by roughly 40 percent and mechanically lifting EPS growth by 3-4 percentage points per year on its own. Management typically announces a fresh buyback authorization around $110 billion each spring. For dividend investors, that matters because every share retired lifts future dividends-per-share proportionally without management actually raising the payout.
Trailing twelve-month free cash flow sits near $100 billion. Apple could, in theory, quadruple the dividend tomorrow and still fund every buyback, every R&D project, and every Vision Pro successor currently in the lab. That it chooses not to is a conscious capital allocation philosophy: Tim Cook and CFO Kevan Parekh have repeatedly signaled a preference for buyback flexibility over dividend rigidity. The result is a dividend that grows at a measured, predictable 5-8 percent per year rather than the double-digit hikes that semiconductor peers deliver.
Apple's AI Positioning: On-Device, Indirect, and Deliberately Patient
Apple's AI strategy is the cleanest illustration of how different its business model is from Broadcom's. Apple Intelligence, the on-device AI suite that shipped with iOS 18.1 in late 2024 and has expanded across the iOS 18 cycle and iOS 26 (Apple renumbered iOS in mid-2025 to align the version with the release year), runs inference locally on Apple silicon (the A17 Pro, A18, and M-series chips). The company is not selling AI compute to hyperscalers. It is not training frontier models for commercial licensing. Apple is using AI to deepen the value of the device in your pocket, which it hopes will drive the next iPhone upgrade cycle and add pricing power to the Services bundle.
The risk embedded in this strategy is that Apple is not capturing the direct AI revenue flowing through the hyperscaler capex cycle. When Meta commits $115-135 billion to 2026 AI infrastructure, almost none of that dollar flows to Apple. When Microsoft tracks toward $120 billion in fiscal 2026 capex (it already spent $37.5 billion in Q2 alone), Apple does not see a cent of that either. Google Search traffic acquisition payments to Apple (roughly $20 billion a year) are the one meaningful exception, but that flow is itself under antitrust pressure. The company is a demand beneficiary (AI features sell more iPhones) rather than a supply beneficiary (selling compute or chips into data centers). For a detailed breakdown of Apple's broader forecast and Services monetization lever, see our pillar Apple stock analysis.
Broadcom (AVGO), The AI Infrastructure Compounder
Broadcom is the answer to a question most retail investors do not know to ask: who actually designs the custom AI chips that Google, Meta, and ByteDance run their frontier models on? Hock Tan's company is arguably the single best-positioned non-Nvidia semiconductor name in the AI buildout, and the most recent quarter made that case in numbers that are hard to argue with.
The Custom Silicon Franchise: XPUs, Google TPU, Meta MTIA
Broadcom's AI business splits into two revenue streams: custom AI accelerators (XPUs) and AI networking silicon. The XPU side is the marquee franchise. Broadcom designs the Google TPU in partnership with Google's silicon team, the Meta MTIA accelerator for Facebook's recommendation workloads, and a third major XPU for ByteDance that powers TikTok's inference fleet. Each of these three customers is a hyperscaler that has chosen Broadcom as its design partner specifically to avoid paying Nvidia's 80 percent gross margins on GPU compute.
The networking side is almost as valuable. Broadcom's Tomahawk and Jericho switches connect GPU and XPU clusters inside AI data centers, with latency characteristics that matter intensely for distributed training runs. When Broadcom management talks about AI revenue growth, they are referring to both XPU shipments and AI-specific networking silicon together. Of the $8.4 billion in Q1 FY2026 AI revenue, roughly 70 percent was XPU-driven and 30 percent was networking.
The AI Revenue Trajectory: $8.4B, $10.7B, and $100B by 2027
Broadcom's Q1 FY2026 results (quarter ended February 1, 2026) delivered $19.31 billion in total revenue, up 29 percent year-over-year. AI semiconductor revenue alone came in at $8.4 billion, up 106 percent. Management guided Q2 AI revenue to $10.7 billion, which would mark another quarter of triple-digit year-over-year growth and 27 percent sequential acceleration. The longer-range target is the one that has analysts reworking their models: Hock Tan has publicly guided to $100 billion in AI revenue by fiscal 2027, which implies the AI line alone will be bigger than Broadcom's entire revenue run-rate just three years ago.
The skeptics focus on two numbers. First, three hyperscalers account for the majority of Broadcom's AI revenue, which creates customer concentration risk if Google, Meta, or ByteDance shifts design work in-house. Second, the $100 billion 2027 target requires AI capex to remain at or above the current $630-700 billion industry run-rate through the period, which is plausible but not certain. Our Broadcom stock pillar breaks down the AI revenue stack, the custom silicon margin math, and the VMware integration in full.
The Dividend Growth Story: 15 Years, 1,200 Percent
Broadcom raised its quarterly dividend to $0.65 in December 2025, the 15th straight annual increase. Annualized that is $2.60 per share, producing a yield of roughly 0.6 percent at the $406.54 closing price. The headline yield is unremarkable. The compounding math is not. Broadcom's dividend has grown roughly 1,200 percent over the past decade, compared to approximately 100 percent for Apple over the same period. A shareholder who bought both stocks in 2015 and reinvested every dividend is now collecting a yield-on-cost in the high single digits from Broadcom versus the low single digits from Apple.
Broadcom's payout ratio is also higher: roughly 45-50 percent of non-GAAP earnings compared to Apple's 13 percent. That signals a very different capital allocation philosophy. Apple retains cash to fund buybacks. Broadcom distributes cash to shareholders. Both are legitimate strategies, and both have been validated by fifteen years of shareholder returns, but they produce meaningfully different dividend-income profiles for investors planning around the payout rather than the price.
Head-to-Head: The Financial Metrics That Matter
The easiest way to frame the comparison is to look at the growth and profitability metrics side-by-side and ask which profile better matches your investment objective. Apple wins on scale, stability, and buyback efficiency. Broadcom wins on growth rate, dividend CAGR, and AI torque.
Financial Dimension | Apple (AAPL) | Broadcom (AVGO) | Winner |
|---|---|---|---|
Revenue Scale (TTM) | ~$420B | ~$67B | Apple |
Revenue Growth (most recent Q) | +16% | +29% | Broadcom |
Gross Margin | ~46% | ~75% | Broadcom |
Operating Margin | ~30% | ~45% (non-GAAP) | Broadcom |
Free Cash Flow (TTM) | ~$100B | ~$27B | Apple |
FCF Margin | ~24% | ~40% | Broadcom |
Net Cash / (Debt) | Net cash ~$55B | Net debt ~$55B | Apple |
Share Repurchase Pace | ~$110B/yr authorized | $10B authorization | Apple |
Dividend Growth CAGR (10Y) | ~7% | ~29% | Broadcom |
Broadcom wins six categories; Apple wins three. But the three Apple wins are the three that matter most for capital preservation: absolute FCF, net cash position, and buyback pace. If markets sell off hard, Apple has $55 billion in net cash and a $100 billion annual FCF engine to defend its business model. Broadcom has $55 billion in net debt from the VMware acquisition and needs continued AI capex to service the balance sheet. In good times, the growth names outperform. In stress, scale and balance sheet matter more.
Dividend Deep Dive: Yield Today, Income Tomorrow
Most dividend investors look at current yield and stop there. That is the wrong framework for a stock comparison like this one. Both Apple and Broadcom have sub-1 percent yields, which makes current income functionally irrelevant as a portfolio driver. What matters is the forward trajectory of the payout and the probability that it continues.
Metric | Apple (AAPL) | Broadcom (AVGO) |
|---|---|---|
Closing Price (Apr 17, 2026) | $270.23 | $406.54 |
52-Week Range | $189.81 – $288.62 | $161.61 – $414.61 |
Market Cap | ~$4.05T | ~$1.91T |
Forward P/E | ~31x | ~32x |
Quarterly Dividend | $0.26 | $0.65 |
Annual Dividend | $1.04 | $2.60 |
Dividend Yield | ~0.4% | ~0.6% |
Consecutive Years of Hikes | 15 | 15 |
10-Year Dividend CAGR | ~7% | ~29% |
Most Recent Quarter Revenue | $143.8B (Q1 FY2026) | $19.31B (Q1 FY2026) |
YoY Revenue Growth | +16% | +29% |
AI Revenue Line | No direct disclosure | $8.4B (Q1, +106% YoY) |
Annual FCF (TTM) | ~$100B | ~$27B |
Run the math on a hypothetical $10,000 position held for ten years. Apple's 7 percent dividend CAGR, applied to a starting yield of 0.4 percent, grows the payout to roughly $1.96 per share by year ten, which at today's price would translate to a yield-on-cost of about 0.7 percent. Broadcom's 29 percent dividend CAGR applied to a starting yield of 0.6 percent grows the payout to roughly $35 per share by year ten, producing a yield-on-cost above 8 percent. That is why sophisticated income investors have been quietly accumulating Broadcom through the 2024-2026 rally even as headline yields stayed low.
The caveat, of course, is sustainability. Broadcom's dividend growth was funded by the Avago-Broadcom merger synergies, the CA Technologies acquisition, the Symantec enterprise security deal, and most recently the VMware integration. Each acquisition materially expanded the free cash flow base and allowed management to lift the dividend without stretching the payout ratio. If the M&A pipeline slows, dividend growth will decelerate toward something closer to organic revenue growth (20-25 percent if AI stays on trajectory, 8-10 percent if it normalizes).
Apple's dividend growth is more predictable but harder to accelerate. Services revenue at 14-16 percent growth and a 75 percent gross margin provides the earnings expansion that funds modest dividend hikes, but management has explicitly prioritized buybacks over dividends. Unless Apple decides to shift capital return philosophy (unlikely under current leadership), expect 5-8 percent annual dividend growth as the base case.
AI Exposure, Direct vs Indirect
This is the dimension where the two stocks diverge most sharply, and it is the one most likely to determine total returns over the next five years. Broadcom has direct AI revenue exposure at scale. Apple does not.
Broadcom's $8.4 billion in Q1 FY2026 AI revenue is real, recurring, and accelerating. Every Google TPU shipment, every Meta MTIA deployment, every ByteDance inference cluster adds to the top line with 70 percent gross margins attached. When hyperscaler capex increased from $200 billion in 2024 to the current $630-700 billion run-rate in 2026, Broadcom captured a disproportionate share of the incremental spending through its custom silicon relationships. For related analysis of where the other winners of this capex cycle sit, see best AI stocks to buy.
Apple benefits from AI in a more indirect way. The company's AI positioning is defensive: use on-device intelligence to protect the iPhone upgrade cycle, keep Services subscribers engaged, and avoid losing users to Android devices that have more aggressive cloud AI integrations. There is a plausible scenario where Apple Intelligence catalyzes the strongest iPhone upgrade cycle since the iPhone 6, which would add $30-50 billion in incremental Services revenue over three years. But that scenario depends on consumer adoption, marketing execution, and competitive dynamics that Apple cannot fully control. It is AI as revenue defense, not AI as revenue offense.
For an investor trying to capture AI torque directly, Broadcom is the clear vehicle. For an investor trying to own the single most profitable consumer tech franchise in history and allow AI to accrete value slowly, Apple is the better fit. Both can be right. The question is which problem you are actually trying to solve.
Valuation: Who Deserves the Higher Multiple?
At first glance, the valuations are nearly identical. Apple trades at approximately 31 times forward earnings; Broadcom trades at approximately 32 times. That is unusual. Historically, a consumer tech franchise with mid-single-digit revenue growth would trade at a significant discount to a semiconductor name growing 29 percent year-over-year. The narrowed gap reflects two different reassessments by the market.
Apple has re-rated upward as Services revenue has compounded and investors have started treating the company as a recurring-revenue platform business rather than a hardware cyclical. The iPhone 17 cycle, the return to growth in China, and the Apple Intelligence narrative have all reinforced the premium multiple. At 31x forward earnings, Apple is pricing in continued Services expansion and successful AI monetization over the next three to five years. If either assumption falters, the multiple compresses.
Broadcom has re-rated upward as the AI revenue line has scaled from a rounding error in 2023 to $8.4 billion per quarter in 2026. At 32x forward earnings, Broadcom is pricing in continued hyperscaler demand for custom silicon and successful execution on the $100 billion 2027 AI revenue target. If AI capex decelerates or if hyperscalers design more of their chips in-house, Broadcom's multiple compresses faster than Apple's because its earnings base is smaller and more concentrated.
Stripping out AI, Broadcom's legacy semiconductor business (broadband, wireless, storage) trades at about 18x forward earnings. Stripping out Services, Apple's hardware business trades at about 22x. The AI premium embedded in Broadcom's valuation is roughly 14 turns of the multiple; the Services premium embedded in Apple is about 9 turns. That tells you where each company's upside lives, and where each company's risk lives.
Risk Profiles: What Could Go Wrong
No comparison is complete without a clear-eyed assessment of the downside. The risks for these two stocks look almost nothing alike.
Apple's Primary Risks
App Store regulation is the biggest structural risk. The EU Digital Markets Act and the ongoing U.S. antitrust cases could force Apple to allow sideloading, reduce developer commissions, or permit alternative app stores at scale. Services revenue growth has run at 14 percent; a regulatory reset could cut that to 5-8 percent, which would meaningfully compress the valuation multiple. China exposure is the second risk. Roughly 15 percent of Apple's revenue comes from Greater China, and the Huawei competitive threat plus broader geopolitical tension create ongoing pressure. The iPhone 17 China rebound is real, but its durability is not guaranteed.
AI execution risk is the third concern. If Apple Intelligence underwhelms consumers and the iPhone upgrade cycle disappoints, the whole premium valuation structure loses its narrative anchor. Apple is 18 months behind OpenAI, Google, and Anthropic on frontier model capability. The company is betting that on-device inference and tight OS integration will be more valuable to consumers than raw model quality. That is a plausible bet, but it is still a bet.
Broadcom's Primary Risks
Customer concentration is the first and most obvious risk. Three hyperscalers account for the majority of Broadcom's AI revenue. If Google develops more of its TPU silicon in-house or if Meta pulls MTIA design work internal, Broadcom's $100 billion 2027 target becomes much harder to reach. Hock Tan has acknowledged this publicly and is actively pursuing additional XPU design wins at Apple (for future data center inference), Microsoft, and Amazon to diversify the customer base.
AI capex normalization is the second risk. Industry capex in 2026 is running at roughly $630-700 billion. If that number plateaus or contracts to $500 billion by 2028, Broadcom's AI revenue growth rate decelerates materially. Third, the VMware integration still carries execution risk. Broadcom has been aggressive on pricing and licensing changes, which has alienated some enterprise customers. The FCF contribution is real, but customer churn is a live issue that shows up in quarterly booking trends.
Finally, Broadcom carries net debt of roughly $55 billion, largely from the VMware deal. At current interest rates, debt service eats a meaningful share of free cash flow, and a refinancing cycle at higher rates would reduce the cash available for dividends and buybacks.
The Verdict: Who Should Own Each?
The honest answer is that most tech-heavy portfolios should own both, in different proportions depending on the investor's time horizon and risk tolerance. But if forced to pick one for a specific objective, the framework is straightforward.
Choose Apple if: you are buying capital preservation with modest upside, you want the largest and most defensive balance sheet in tech, you care more about buyback-driven EPS accretion than dividend growth, and you believe the Services franchise will continue to compound at double-digit rates regardless of how the AI race plays out. Apple is the stock you own if your investment timeline is measured in decades and you need to sleep at night through a correction.
Choose Broadcom if: you are buying direct exposure to the AI infrastructure buildout, you want a dividend that compounds at 20-30 percent per year, you are comfortable with customer concentration and acquisition integration risk, and you believe hyperscaler capex stays above $500 billion through 2028. Broadcom is the stock you own if you want the torque of the AI cycle in your portfolio without taking NVIDIA's valuation risk.
For most investors building a tech-focused dividend portfolio, the right answer is to own both at roughly equal weights, let the dividends reinvest, and revisit the allocation every 12-18 months as the AI capex cycle evolves. The 10-year dividend growth gap (roughly 100 percent for Apple versus 1,200 percent for Broadcom) means that time is on Broadcom's side if its AI thesis holds. But Apple's balance sheet and Services franchise mean that time is not a risk to the Apple thesis the way it might be to other mega-cap tech names.
Related reading: the tech stocks guide for Magnificent Seven positioning, and NVIDIA stock for the benchmark AI infrastructure name these two companies compete with at different points in the stack.
FAQ
Frequently asked questions
Is Apple or Broadcom the better dividend stock in 2026?
u003cpu003eIt depends on what you mean by better. Apple is the safer dividend stock, with $100 billion in annual free cash flow, a 13 percent payout ratio, and a 15-year track record of modest 5-8 percent annual increases. Broadcom is the better dividend growth stock, with a roughly 29 percent 10-year dividend CAGR and direct exposure to the AI capex cycle. For pure income safety, Apple. For compounding income, Broadcom.u003c/pu003e
What is the dividend yield on Apple versus Broadcom?
u003cpu003eAt the April 17, 2026 closing prices, Apple (AAPL) yields approximately 0.4 percent on its $1.04 annual dividend, and Broadcom (AVGO) yields approximately 0.6 percent on its $2.60 annual dividend. Both are low headline yields relative to the broader S&P 500 average near 1.3 percent. The story is in the forward growth rate, not the starting yield.u003c/pu003e
Which company has more direct AI revenue exposure?
u003cpu003eBroadcom has dramatically more direct AI revenue. The company reported $8.4 billion in Q1 FY2026 AI revenue and is guiding to $10.7 billion for Q2, with a longer-range $100 billion target by fiscal 2027. Apple does not disclose a separate AI revenue line at all; its AI strategy is on-device intelligence designed to defend the iPhone and Services franchises rather than sell AI compute to third parties.u003c/pu003e
How have Apple and Broadcom dividends grown over the past decade?
u003cpu003eApple's dividend has grown approximately 100 percent over the past 10 years, representing roughly 7 percent compound annual growth. Broadcom's dividend has grown approximately 1,200 percent over the same period, representing roughly 29 percent compound annual growth. The gap reflects Broadcom's more aggressive payout ratio and its ability to layer acquisition-funded earnings growth (CA Technologies, Symantec, VMware) onto organic dividend expansion.u003c/pu003e
What are the biggest risks to each stock in 2026 and beyond?
u003cpu003eApple's biggest risks are App Store regulation (EU DMA plus US antitrust), China competitive and geopolitical pressure, and the possibility that Apple Intelligence fails to drive the iPhone 17 upgrade cycle analysts are modeling. Broadcom's biggest risks are customer concentration (three hyperscalers drive most AI revenue), AI capex normalization if hyperscaler spending plateaus, and the debt load of roughly $55 billion from the VMware acquisition.u003c/pu003e
Should I own both Apple and Broadcom in a diversified portfolio?
u003cpu003eFor most tech-focused dividend investors, holding both at roughly equal weights is a reasonable approach. Apple provides the defensive core (cash flow stability, massive buyback program, balance sheet strength), and Broadcom provides the offensive torque (AI revenue growth, aggressive dividend compounding, custom silicon franchise). The two exposures are complementary rather than redundant, since one is demand-side and the other is supply-side to the AI buildout.u003c/pu003e
Disclaimer
This article is for informational purposes only and does not constitute financial, investment, tax, or legal advice. Market data, tax rules, and prices can change after the article date. TECHi and its authors may hold positions in securities or digital assets mentioned. Always conduct your own research and consult a licensed financial, tax, or legal professional before making decisions.
About the Author

Fatima Fakhar covers the AI infrastructure stack for TECHi — GPU roadmaps, ASIC design wins, foundry capacity, and the LLM benchmarks that actually hold up outside vendor demos. She tracks Nvidia, AMD, TSMC, and Broadcom earnings alongside SemiAnalysis teardowns, and tests consumer-facing AI tools herself before writing about them. Her reporting leans skeptical on hype cycles and specific on the numbers that matter: utilization rates, HBM allocations, and the gap between announced and shipping silicon.