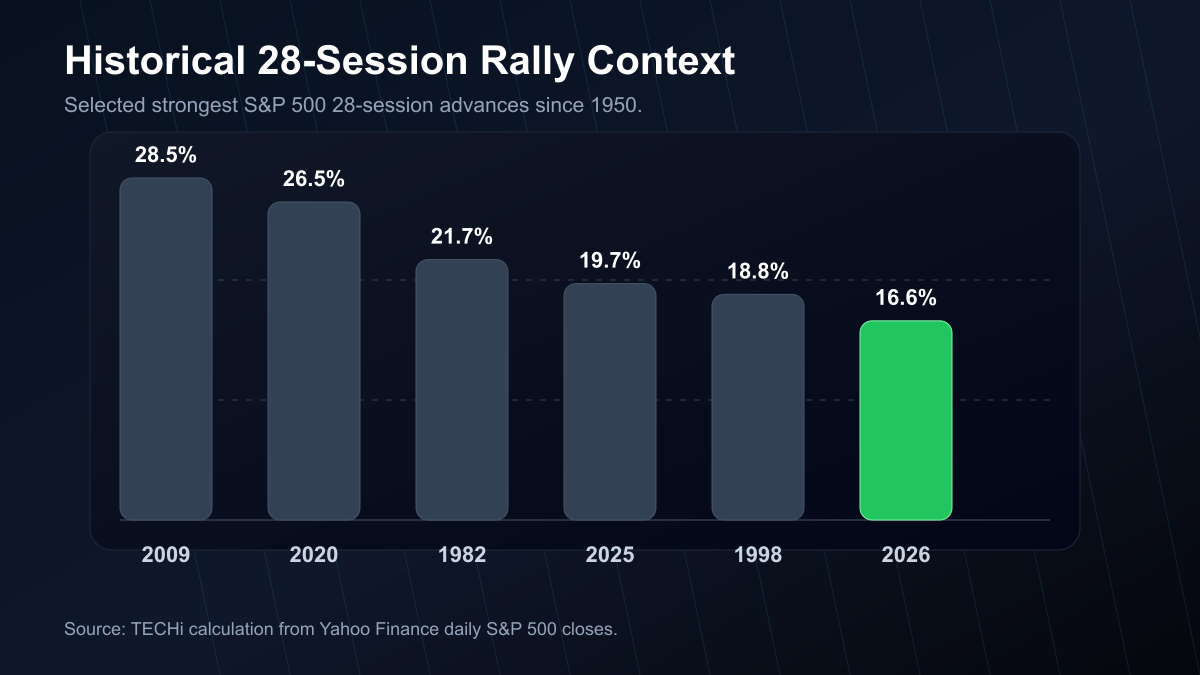
- Rally magnitudeThe S&P 500 gained roughly 16.6% in 28 trading sessions from the March 30 close to the May 8 record close.
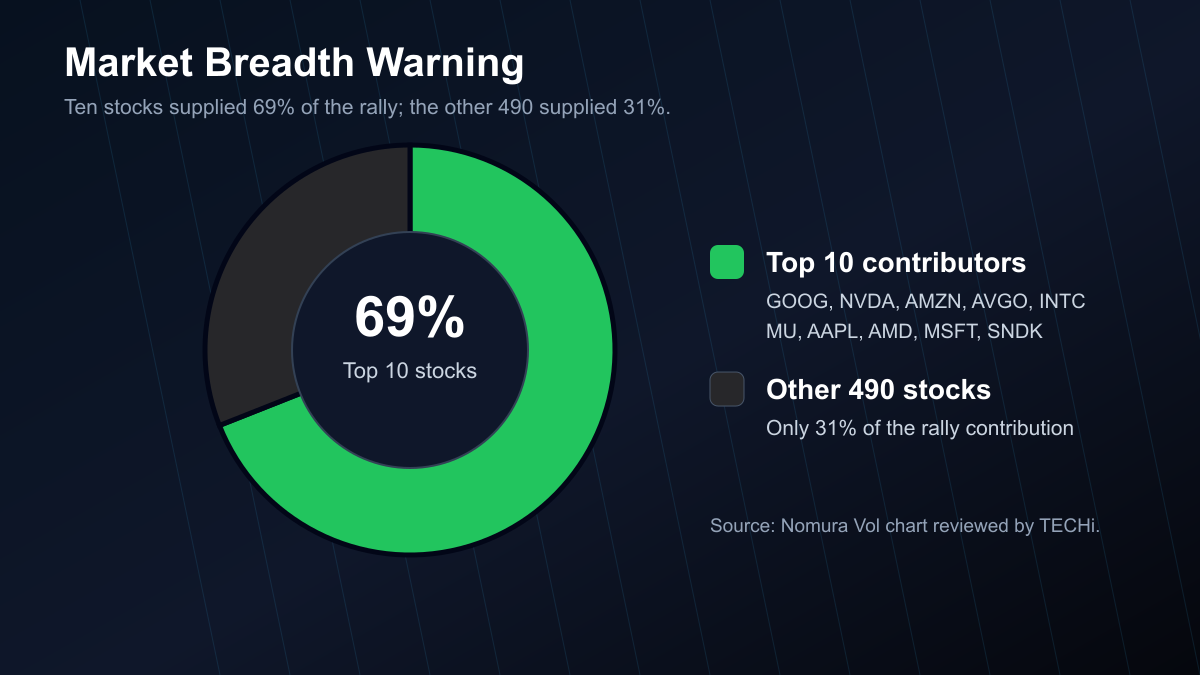
- ConcentrationNomura Vol attribution shows 10 stocks drove 69% of the rally, leaving the other 490 stocks with 31%.
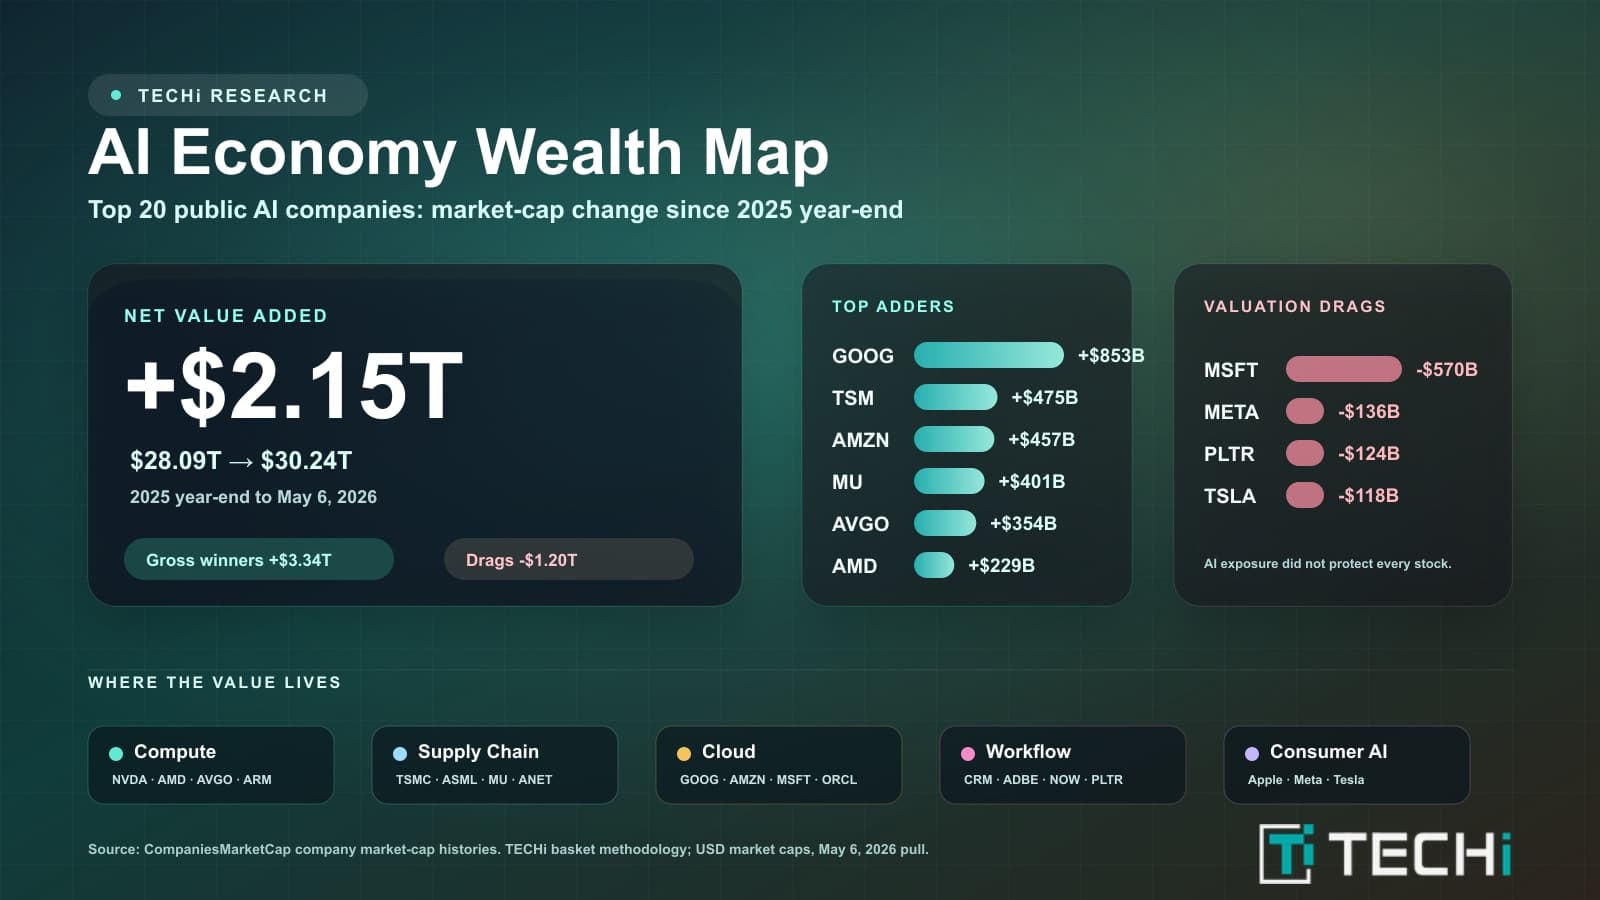
- Sector themeThe top contributors cluster around AI infrastructure: cloud platforms, GPUs, memory, storage and networking.
- Breadth warningThe rally can continue, but the current leadership mix makes the index fragile if AI leaders stumble.
- Sustainability testThe next leg needs earnings growth, capex productivity and broader participation, not only megacap AI momentum.
The S&P 500 just posted one of its strongest 28-session rallies in decades. The headline number is impressive. The market structure underneath it is less comfortable.
The index closed at 7,398.93 on Friday, May 8, 2026, after adding 0.8% on the day, according to AP’s market wrap. That left the benchmark up roughly 16.6% in 28 trading sessions from its March 30 close of 6,343.72, based on TECHi’s calculation from Yahoo Finance historical S&P 500 data. From the March 30 intraday low of 6,316.91, the rebound is even larger.
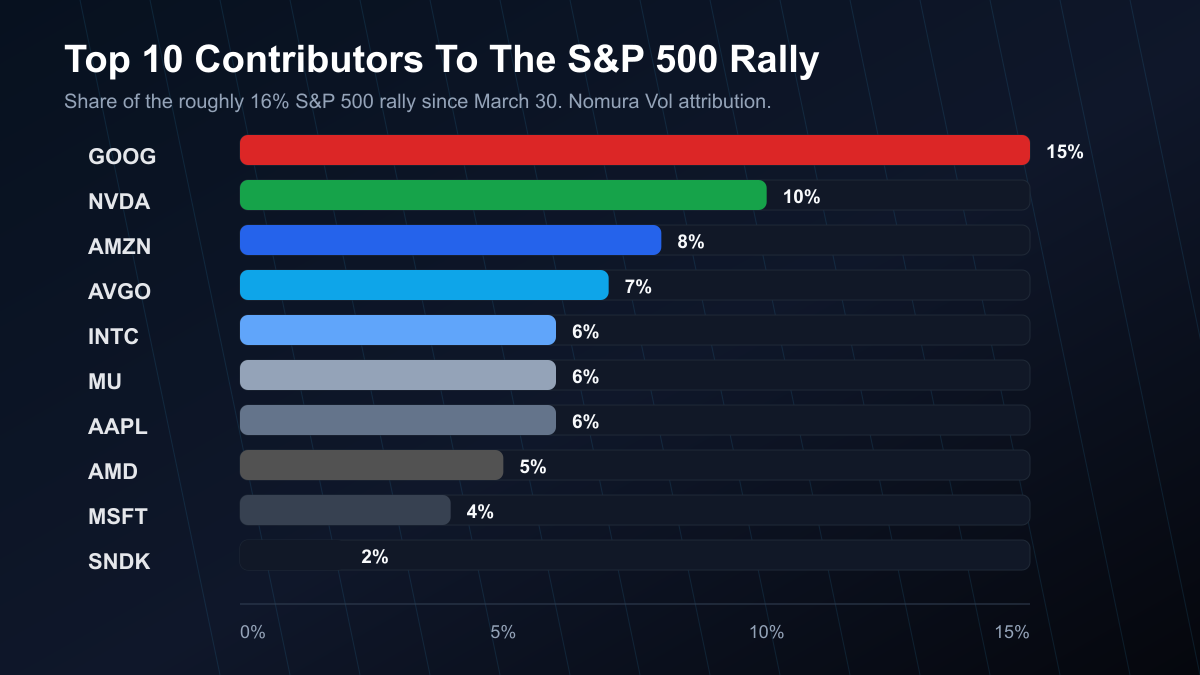
That is the rally magnitude. The more revealing number is the distribution of the rally. A Nomura Vol return-attribution chart reviewed by TECHi shows that 10 stocks drove 69% of the S&P 500’s roughly 16% advance since March 30, while the other 490 stocks contributed 31%.
The tape is up. The index is at a record. But the foundation is narrow enough that investors should separate two questions: can the rally continue, and can it continue with this leadership structure?
Rally magnitude: a fast recovery from the March 30 low
The March 30 low came after the S&P 500 had fallen 9.8% from its January high, a drawdown tied to the U.S.-Israel war with Iran and the oil-price shock, according to Yahoo Finance’s April 15 market report. By April 15, the index had already reclaimed a record close. By May 8, it had pushed to another all-time high.
The 28-session return is not ordinary market noise. In a TECHi calculation using Yahoo Finance daily closes going back to 1928, the May 8 close-to-close gain from March 30 ranks among the strongest 28-session S&P 500 advances since 1950. The largest comparable bursts came after crisis lows or violent reversals: 2009, 2020, 1982, 1998, 1991, 1974, and 1975.
That history gives the rally two readings. The bullish reading is that sharp recoveries from panic lows can mark the start of durable advances. The cautious reading is that moves this fast usually price a lot of good news before the average stock has caught up. TECHi’s earlier S&P 500 de-escalation rally coverage captured the first leg of that relief trade; this move is now testing whether the follow-through is broad enough.
Market concentration: 10 stocks carried almost 70% of the move
The Nomura Vol chart breaks the rally into a blunt return-contribution map. These are not individual stock returns. They are estimated shares of the S&P 500’s total rally contribution.
- Alphabet / GOOG: 15% of the S&P 500 rally, or roughly 2.4 percentage points of the 16% index move.
- Nvidia / NVDA: 10%, or roughly 1.6 percentage points.
- Amazon / AMZN: 8%, or roughly 1.3 percentage points.
- Broadcom / AVGO: 7%, or roughly 1.1 percentage points.
- Intel / INTC: 6%, or roughly 1.0 percentage point.
- Micron / MU: 6%, or roughly 1.0 percentage point.
- Apple / AAPL: 6%, or roughly 1.0 percentage point.
- Advanced Micro Devices / AMD: 5%, or roughly 0.8 percentage point.
- Microsoft / MSFT: 4%, or roughly 0.6 percentage point.
- SanDisk / SNDK: 2%, or roughly 0.3 percentage point.
The other 490 S&P 500 stocks together supplied 31% of the rally.
That is why the rally feels powerful at the index level but less convincing underneath. Investors buying the benchmark are getting a large dose of AI hardware, cloud platforms, memory, semiconductors, and a handful of mega-cap balance sheets.
TECHi’s recent Nvidia GPU debt-cliff analysis looked at the financing risk inside AI infrastructure. This S&P 500 rally is the equity-index version of the same issue: the market is assigning extraordinary weight to a small group of companies tied to AI infrastructure and the capital cycle around it.
Sector theme: AI infrastructure, not generic tech
The top 10 list is not simply “Big Tech.” It is more specific.
Alphabet and Amazon connect the rally to cloud demand. Nvidia, Broadcom, AMD and Intel connect it to chips, custom silicon, networking and compute. Micron and SanDisk connect it to memory and storage. Microsoft connects it to Azure and enterprise AI. Apple is the least direct AI-capex name in the group, but its index weight still makes it a major contributor when megacap sentiment improves.
That theme lined up with the May 6 tape. Reuters reported that the S&P 500 and Nasdaq hit records as strong AMD results sparked an AI stock rally, with more than 80% of S&P 500 companies that had reported through May 1 beating profit estimates, according to LSEG I/B/E/S data.
This is why the rally is stronger than a meme-stock squeeze but narrower than a healthy all-sector advance. Earnings helped. AI capex helped. Lower oil pressure and Middle East de-escalation hopes helped. But the market’s leadership is still clustered around one capital-spending cycle. For a stock-level view of that semiconductor fight, TECHi’s AMD vs Nvidia stock comparison is the cleaner read-through.
AI capex is the fuel and the risk
The AI capex cycle is the bridge between the rally’s winners.
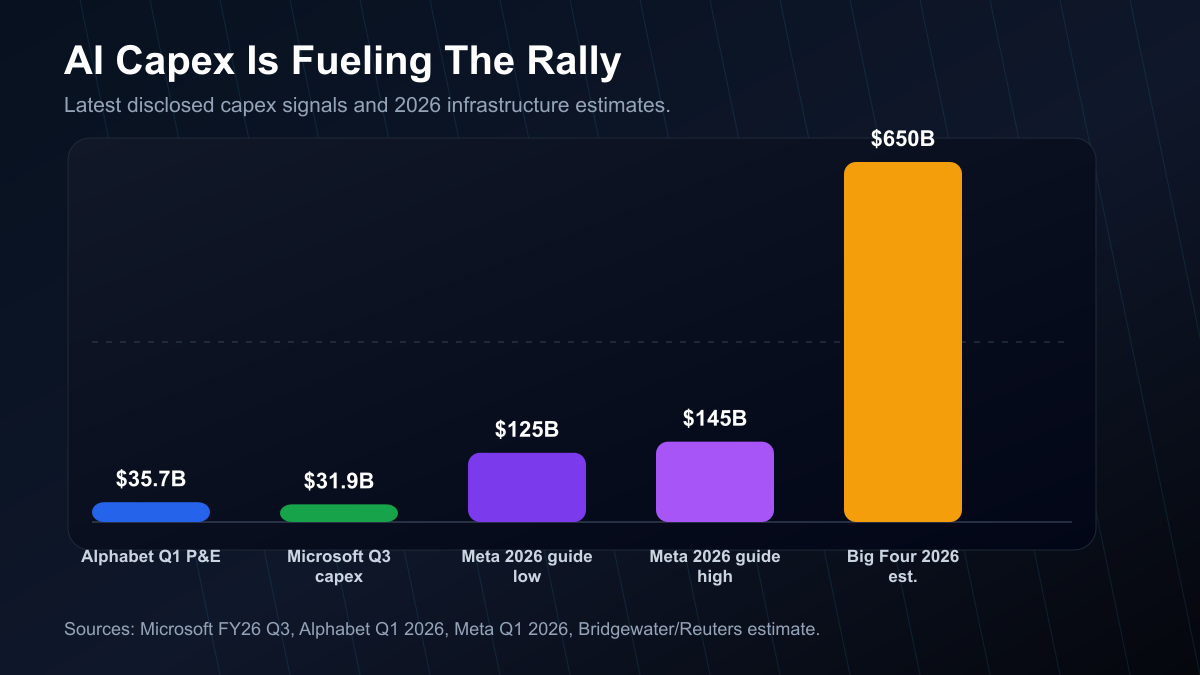
Bridgewater Associates estimated that Alphabet, Amazon, Meta and Microsoft could collectively invest about $650 billion in AI-related infrastructure in 2026, according to Reuters reporting carried by Investing.com. That money flows into data centers, GPUs, memory, networking, power systems and cloud capacity.
The official company numbers show the same direction. Microsoft said capital expenditures were $31.9 billion in its fiscal third quarter as it continued building cloud and AI infrastructure. Alphabet’s Q1 2026 release showed $35.7 billion of property and equipment purchases in the quarter. Meta raised its 2026 capital expenditure outlook to $125 billion to $145 billion, including principal payments on finance leases.
That explains why the market rewarded chip and memory names so aggressively. If hyperscalers keep spending, Nvidia, Broadcom, AMD, Intel, Micron and SanDisk sit close to the spending stream. TECHi’s Micron and Nvidia memory analysis covered that same mechanism from the HBM and memory side.
The risk is that capex is a front-loaded bet. If AI revenue, cloud utilization and inference economics do not scale fast enough, investors may start treating the same spending that lifted the rally as a margin and free-cash-flow problem.
Breadth warning: strong index, thinner participation
A concentrated rally is not automatically bearish. The best companies often lead. Market-cap-weighted indexes are designed to give larger companies more influence.
The warning is about fragility. If 10 stocks can drive 69% of a 28-session rally, then a disappointment in those stocks can also pull the index down faster than the headline diversification suggests.
RBC Wealth Management wrote in January that the market-cap-weighted S&P 500 had outperformed its equal-weighted counterpart by roughly 32% over the prior three years, a sign that mega-cap leadership had overwhelmed the average stock. Charles Schwab has also warned that the largest 10 S&P 500 companies together represented about 40% of the index’s market capitalization as of August 31, 2025, above the levels reached around the dot-com peak.
That does not mean the index must fall. It means breadth now matters more. A sustainable rally needs more contribution from industrials, financials, healthcare, consumer stocks, and smaller technology companies. Without that broadening, the S&P 500 becomes less a diversified market barometer and more a leveraged view on AI infrastructure winners.
Historical context: this is not a normal 28-session climb
A 16%-plus 28-session S&P 500 rally is rare outside snapback environments.
The strongest examples since 1950 usually appeared after acute stress: the 2009 financial-crisis bottom, the 2020 pandemic low, the 1982 inflation-and-rate reversal, and the 1974 bear-market trough. The current move shares the relief-rally character because it began from a geopolitical and oil-shock selloff, not from a quiet earnings rerating.
That context cuts both ways. Relief rallies can run when investors realize the feared recession or policy shock is not arriving. They can also stall when the easiest re-rating is complete and the market needs earnings, margins and breadth to justify the new price. The other side of this same debate is visible in TECHi’s Goldman S&P 500 bear-case analysis, which framed how quickly downside scenarios can re-enter the conversation when leadership narrows.
The May 2026 version has one extra feature: it is tied to AI capex rather than a broad economic rebound alone.
Dot-com bubble comparison: similar concentration, different cash flows
The dot-com comparison is unavoidable because concentration is again extreme and investors are again valuing a technology buildout before all returns are visible.
There are real similarities. A small group of companies is dominating index returns. Investors are paying up for infrastructure that is supposed to define the next computing era. Capital spending is being justified by a future demand curve that is still uncertain.
There are also major differences. Many of today’s leaders have enormous revenue, operating income and cash reserves. The late-1990s market included many companies with weak business models and no clear path to profits. Britannica’s dot-com history notes that between March 2000 and October 2002, the Nasdaq fell from 5,048 to 1,139 as the bubble unwound.
The better comparison is not “AI equals dot-com.” It is this: the internet was real, but the 2000 price and capital-allocation assumptions were too aggressive. AI may be real too. The market still has to prove that the capex, valuation and concentration now attached to AI can produce enough cash flow across the whole index.
Is this rally sustainable?
The pace is not sustainable. A market cannot compound at a 16% gain every 28 sessions without detaching from earnings.
The trend can be sustainable if four things happen.
First, profit growth has to keep improving. Reuters reported that S&P 500 earnings were expected to rise 22.6% for full-year 2026, according to LSEG I/B/E/S, while the index traded at 21.2 times expected 12-month earnings. That is a demanding but not absurd setup if earnings revisions keep moving higher.
Second, AI capex has to translate into revenue rather than only bigger depreciation, lease commitments and lower free cash flow. The market is treating AI infrastructure as productive investment. That assumption needs proof across 2026 and 2027.
Third, breadth has to improve. The other 490 stocks do not need to beat the top 10, but they need to contribute more than 31% if this is going to look like a durable bull market rather than a narrow AI-led melt-up.
Fourth, macro risk has to stay contained. The rally began as oil and geopolitical fear eased. If energy prices, rates or inflation expectations turn higher again, the valuation cushion is thin.
So the answer is conditional. The S&P 500 rally can keep working, but not if it remains this concentrated and not if AI capex turns from growth fuel into a cash-flow drag. The index has already made the easy move from panic to relief. The next leg has to be earned.
FAQ
Frequently asked questions
How much did the S&P 500 gain in the 28-session rally?
From the March 30, 2026 close to the May 8, 2026 close, the S&P 500 rose about 16.6%, based on TECHi’s calculation from Yahoo Finance daily closes.
Which stocks drove most of the S&P 500 rally?
According to the Nomura Vol attribution chart reviewed by TECHi, Alphabet, Nvidia, Amazon, Broadcom, Intel, Micron, Apple, AMD, Microsoft and SanDisk drove 69% of the rally.
Is the S&P 500 rally broad based?
Not fully. The other 490 S&P 500 stocks contributed 31% of the roughly 16% rally, which makes breadth a key warning sign.
Is this rally like the dot-com bubble?
There are similarities in market concentration and technology excitement, but today’s leaders generally have stronger revenue, cash flow and balance sheets than many dot-com-era companies.
Is the S&P 500 rally sustainable?
The pace is unlikely to be sustainable, but the trend can continue if earnings growth broadens, AI capex produces visible returns, and more sectors participate.
Disclaimer
This article is for informational purposes only and does not constitute financial, investment, tax, or legal advice. Market data, tax rules, and prices can change after the article date. TECHi and its authors may hold positions in securities or digital assets mentioned. Always conduct your own research and consult a licensed financial, tax, or legal professional before making decisions.
About the Author

Hazel Kaya writes TECHi's long-form pillar coverage of the semiconductor industry — foundries, equipment makers, design houses, and the end-market demand reshaping them. Her pieces draw on SIA shipment data, export-control filings, and capex guidance from TSMC, Samsung, and Intel. Readers come to her work for the multi-year structural view: which categories are consolidating, which are commoditizing, and how AI compute demand is rewriting the old cyclical rules.