Tesla reports second-quarter deliveries on Wednesday, July 2, 2026, and Wall Street has already written the headline: the company-compiled consensus is 406,024 vehicles. The stock walked into the print at $425.30, up 1.1% on July 1 and 24% above its April low, which tells you the market expects the number to clear.
The headline is the least interesting part of the release. Tesla's delivery report is really three reports stapled together, and the other two get skimmed every quarter. One is the production line: last quarter Tesla built 50,363 more cars than it delivered, and whether that gap closed or widened decides if the April inventory scare was a blip or a trend. The other is a single line near the bottom — energy storage deployed, measured in gigawatt-hours — that carries a 39.5% gross margin, double the car business, and is coming off its worst quarter in over a year.
Read all three together and the July 2 release stops being a demand check and becomes something more specific: a test of whether the company that just spent a quarter growing everywhere except its home market can also fund the AI ambitions its $1.6 trillion valuation actually prices.
- The barQ2 2026 deliveries land July 2 against a company-compiled consensus of 406,024 — about 5.7% growth on last year, carried almost entirely by Europe while U.S. sales decline roughly 20% after the tax-credit expiration.
- The hidden numberTesla built 50,363 more cars than it delivered in Q1. Whether the production–delivery gap closes or compounds is the quality signal inside the headline.
- The margin engineEnergy storage carries a 39.5% gross margin, double the car business. The expected recovery from 8.8 to 13.8 GWh is worth roughly as much gross profit as 56,000 vehicle deliveries.
- The stakesTSLA enters the print at $425.30 — 24% above its April low — with a $1.6 trillion valuation priced on robotaxi and AI, funded by the cars-plus-energy cash machine this report measures.
- The sequenceJuly 2 deliveries, Monday China registration data, then July 22 earnings — units first, margins second, narrative third.
The bar: 406,024, and why it's a strange kind of easy
Start with the consensus itself. Tesla's company-compiled analyst consensus sits at 406,024 vehicles; the Bloomberg consensus is a touch lower near 397,000. Against roughly 384,000 deliveries in the second quarter of 2025 and 358,023 in the first quarter, the bar implies about 5.7% growth year over year and 13% sequentially.
What makes the bar reachable is geography, and what makes it strange is the same thing. Per Yahoo Finance's preview, Europe is carrying the quarter — deliveries there rose 108% year over year in May and 57% year to date, with EU registrations up 152% in May — while Deutsche Bank pegs China at about 3% growth and the U.S. at a 21% decline, the hangover from expired federal EV tax credits. "International strength is doing the heavy lifting," as Deutsche Bank's Edison Yu put it.
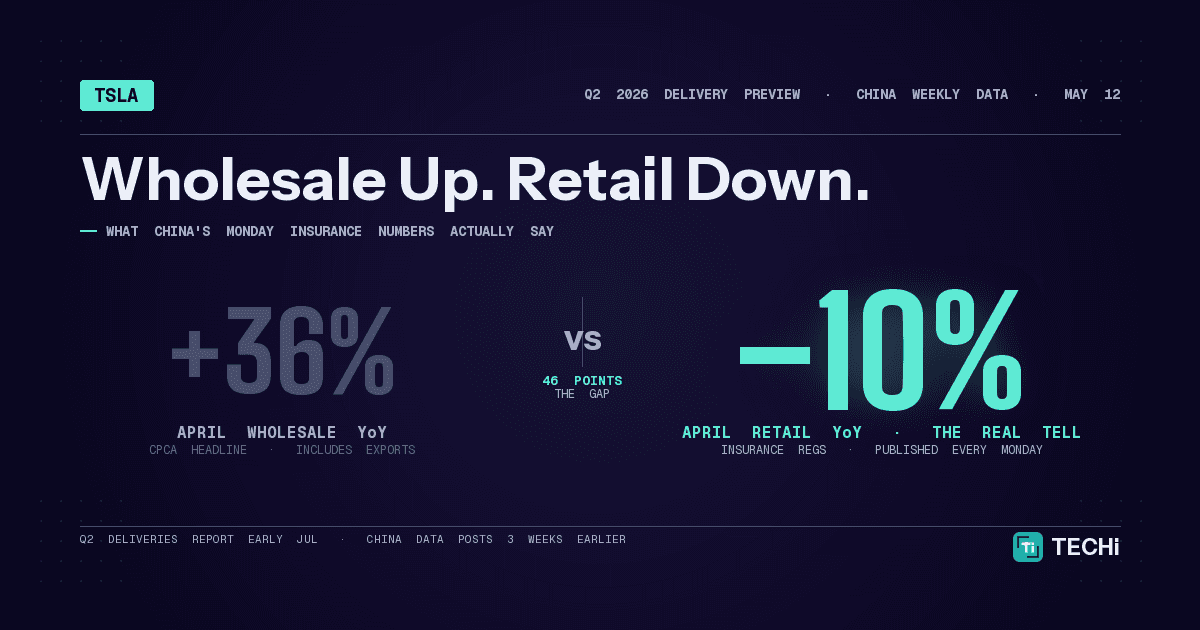
Sit with that mix for a moment. Tesla can clear a growth bar this quarter while its largest, most profitable market shrinks by a fifth. The company has quietly become an export-led growth story, which is a workable model — German automakers ran it for decades — but it is a different company than the one the U.S. demand machine built, and it leaves the print hostage to European momentum holding. TECHi's China insurance-registration tracker flagged in May that the weekly data would make this quarter legible in advance; the weekly cadence is why several banks expect a beat rather than a miss.
The quarter Europe has to keep carrying
Before treating the European numbers as a new steady state, look at what they are made of. A 108% year-over-year jump in May is partly real momentum — the refreshed Model Y cycle landing in a market where fleet buyers respond quickly to total-cost math — and partly arithmetic, because the comparison lands on one of the weakest stretches of Tesla’s 2025 in Europe. Growth rates built on soft bases have a short shelf life: as the calendar rolls into the second half, the comparisons get progressively harder, and the 57% year-to-date pace will regress toward whatever underlying demand actually is.
That is the uncomfortable structure of Wednesday’s beat scenario. The market it depends on is the one with the least durable growth rate, while the market with the deepest profit pool — the United States — is establishing a new, lower baseline without federal purchase incentives. The 3% Deutsche Bank models for China reads as the healthiest number of the three precisely because it claims so little: in the most competitive EV market on earth, holding share flat is an achievement. The delivery print will tell investors whether the export engine cleared the bar once. It cannot tell them whether the engine holds through the third quarter, which is why the weekly registration cadence matters more after the print than before it.
Number two: the 50,363-car question
The number nobody puts in a headline sits in the first table of Tesla's own release. In the first-quarter report, filed with the SEC on April 2, Tesla disclosed production of 408,386 vehicles against those 358,023 deliveries. The difference — 50,363 cars — went into inventory, and the stock's slide to its April 8 low of $343.25 tracked that disclosure, not the delivery miss itself.
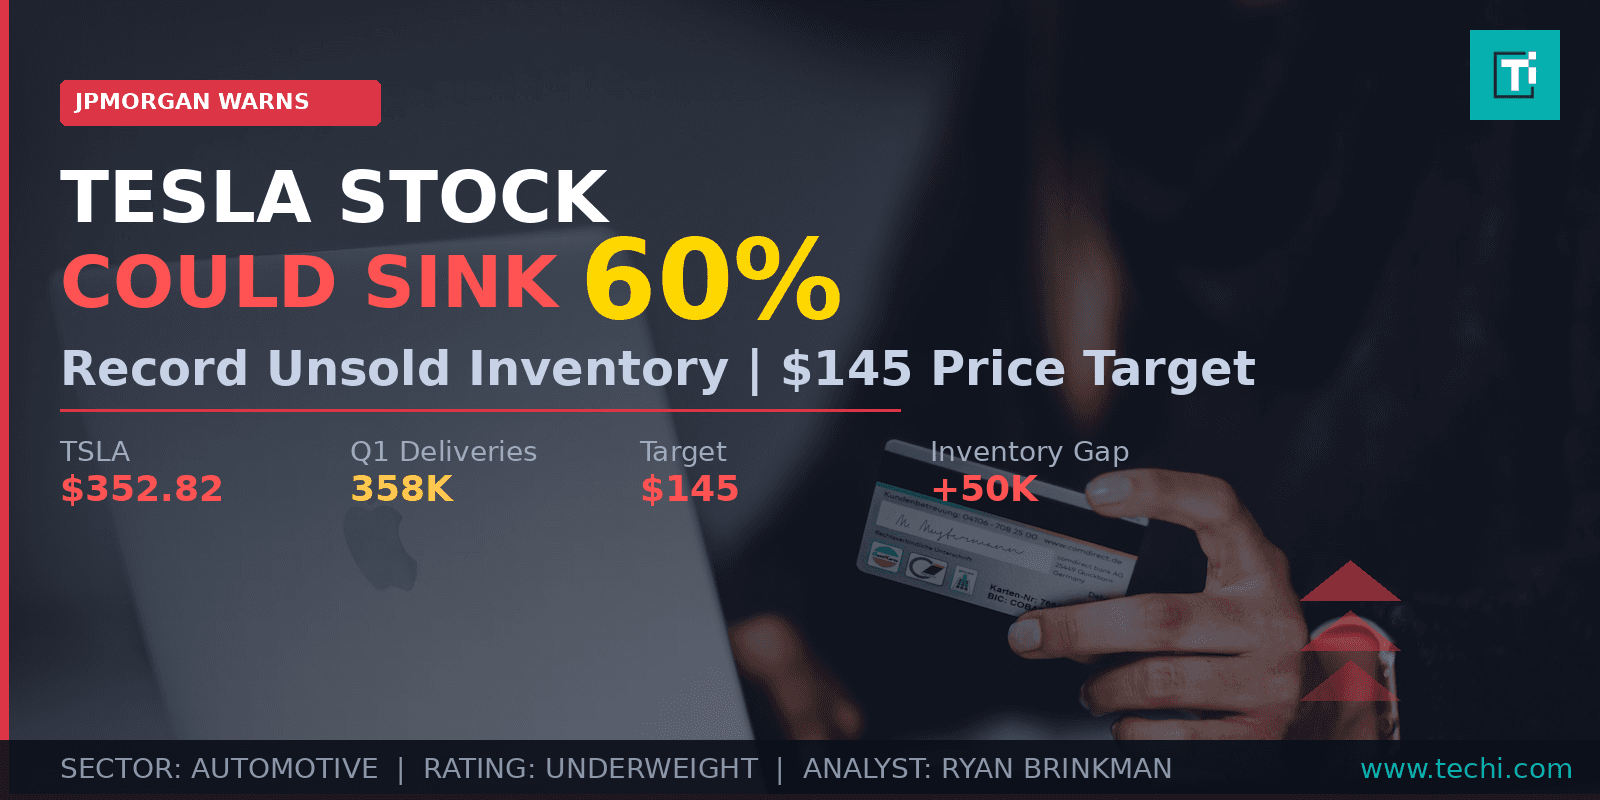
Inventory is where EV bear cases live. JPMorgan's record-inventory warning and $145 target rested on exactly this arithmetic: cars built but not sold are demand borrowed from the future, discounts waiting to happen, or both. So the second number to check on July 2 is not deliveries against consensus but production against deliveries. A quarter where deliveries hit 406,000 while production holds near 400,000 means Tesla cleared tens of thousands of parked vehicles — a genuinely bullish quality signal even if the headline only matches expectations, though it would carry a margin footnote if discounting did the clearing. Another quarter of production running 40,000-plus ahead of deliveries means the overhang is compounding into the second half, and the April questions come back with the stock 24% higher than where it asked them last time.
Number three: the energy line does the margin work
The third number is one line, easy to miss: energy storage deployed. In the first quarter it was 8.8 GWh — down 38% from Q4 2025's 14.2 GWh and well short of expectations. Consensus for the second quarter is about 13.8 GWh, a recovery premised on Megafactory Shanghai ramping toward capacity.
Here is why that swing matters more than it looks. Tesla's first-quarter 10-Q shows the energy generation and storage segment earned a 39.5% gross margin, against 18.9% for automotive and services combined. Energy produced $2.4 billion of revenue — about 11% of the company total — but roughly a fifth of Tesla's entire gross profit.
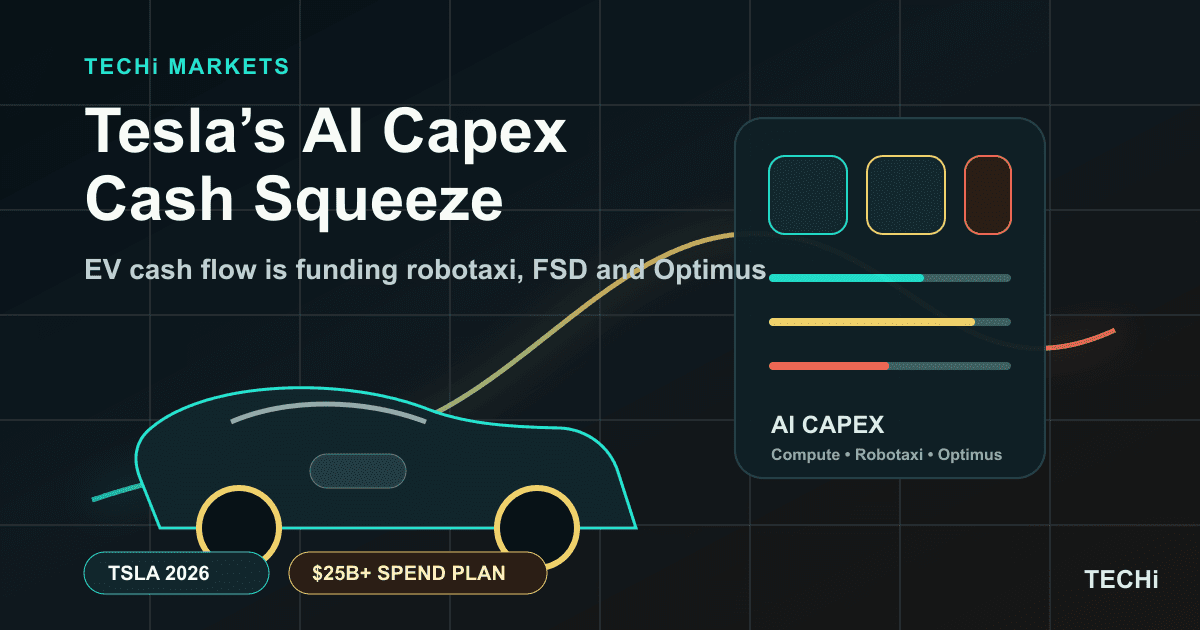
Run the rough arithmetic on the consensus recovery. At first-quarter economics, each deployed gigawatt-hour corresponded to something like $270 million of segment revenue, of which about 40 cents on the dollar was gross profit. The five-gigawatt-hour swing consensus expects — 8.8 to 13.8 — is therefore worth on the order of $540 million in gross profit. At the first quarter's automotive gross profit of roughly $9,600 per vehicle, that single line is worth about as much as 56,000 car deliveries. The numbers are directional — deployment timing and mix move them — but the conclusion is not: the margin engine in Wednesday's report is the line everyone skims, and it is the one that determines whether Tesla's cash generation can keep absorbing what TECHi's May analysis called the AI capex bill eating the EV cash machine.

There is a competitive footnote worth stating plainly. BYD is expected to report around 557,000 battery-electric deliveries for the same quarter — the volume crown left the building some time ago. The contest Tesla is actually in is margin quality per unit of growth, and on that field the energy business, not the Model Y, is the sharpest weapon it has.
The line items the pros will scan before the close
Two smaller disclosures in the same release deserve a scan. The first is the "Other Models" row — everything that is not a Model 3 or Model Y. In the first quarter it showed 13,775 vehicles produced against 16,130 delivered, which means Tesla sold down inventory of its premium and Cybertruck lines faster than it replaced them. A mix in which more than 95% of volume is two mid-market models is operationally efficient and strategically narrow: average selling prices lean on two products, and the halo vehicles that justified years of engineering spending are rounding errors in the count.
The second is invisible in the delivery release but frames it: services and other revenue reached $3.7 billion in the first quarter, up 42% year over year — faster growth than the car business, built on the Supercharger network, repairs, and used-vehicle sales. Its gross margin remains thin, under 10%, but the trajectory matters because it is the third leg of the cash machine that funds the AI program. A company delivering 406,000 cars a quarter now books more than $6 billion a quarter from businesses that are not selling new cars — energy plus services — and both lines compound whether or not the delivery headline beats by four thousand units.
What the stock has already decided
Tesla's 2026 chart is a round trip with an opinion. The stock peaked at $451.67 on January 5, fell 24% to $343.25 by April 8 as the delivery miss and inventory build landed, and has since recovered to $425.30 — down about 3% for the year, with a market value near $1.6 trillion on 3.76 billion shares.

A $1.6 trillion valuation does not come from 406,000 cars a quarter; at automotive multiples the vehicle business explains a fraction of it. The remainder is the robotaxi and AI story, which TECHi has examined through fleet density economics and which no delivery print can validate or falsify. What Wednesday's numbers do decide is the runway: whether the cars-plus-energy cash machine is strong enough to keep funding the autonomy buildout without the balance-sheet strain that turns a story stock into a show-me stock. That is why the second and third numbers matter more than the first — they are the funding report inside the demand report. Live pricing and the full financial picture sit on TECHi's Tesla quote page.
How to read whatever prints
The market's reflex on delivery day is one comparison and one candle. The better read is the combination. A headline beat built on inventory drawdown and a storage recovery is the strongest version of this report — it would say demand absorbed the tax-credit shock, the overhang is clearing, and the margin engine is back online three weeks before the July 22 earnings call has to prove it in dollars. An in-line number with another production overbuild is the trap version: the headline satisfies the algorithms while the quality deteriorates underneath. And a miss on deliveries with storage stuck near single digits reopens every April question — this time with the stock a hundred dollars higher.
What to watch after the print
The delivery release is the opening act of a three-week sequence. The July 22 earnings report converts units into margins — automotive gross margin excluding credits, and whether energy holds near 40% at higher volume, are the two lines that extend or end Wednesday's narrative. The Monday-cadence China insurance registrations show within days whether third-quarter demand holds the second quarter's pace. And the first full quarter of post-credit U.S. data starts building the baseline that decides whether the home market's 20% decline was a cliff or a step. The print moves the stock for a day; those three decide where it is in October.
Not investment advice. This article is for information only. Delivery consensus figures are estimates, per-unit profit arithmetic is directional, and quarterly results may differ materially. Figures reflect trading on July 1, 2026 and filings available before the July 2 report. Do your own research before making investment decisions.
FAQ
Frequently asked questions
When does Tesla report Q2 2026 deliveries?
Tesla is expected to release second-quarter 2026 production, delivery and deployment numbers on Wednesday, July 2, 2026, with the full earnings report following on July 22 after market close.
What is the delivery consensus for Tesla's Q2 2026?
The company-compiled analyst consensus is 406,024 vehicles, with the Bloomberg consensus slightly lower near 397,000. That compares with 358,023 deliveries in Q1 2026 and roughly 384,000 in the second quarter of 2025 — about 5.7% year-over-year growth at the consensus number.
Why did Tesla build 50,000 more cars than it delivered last quarter?
In Q1 2026 Tesla produced 408,386 vehicles but delivered 358,023 — a gap of 50,363 that went into inventory as U.S. demand cooled after federal EV tax credits expired. Whether Q2 draws that inventory down or adds to it is one of the most important numbers in the July 2 report.
How big is Tesla's energy business?
In Q1 2026, energy generation and storage produced $2.4 billion of revenue — about 11% of Tesla's total — but carried a 39.5% gross margin versus 18.9% for the automotive and services segment, making it roughly 20% of gross profit. Deployments fell to 8.8 GWh in Q1; consensus expects about 13.8 GWh for Q2.
Is Tesla stock up or down in 2026?
Slightly down. TSLA closed July 1, 2026 at $425.30 — about 3% below its January 2 starting point, 6% below its January 5 peak of $451.67, and 24% above its April 8 low of $343.25, which followed the Q1 delivery miss and inventory build.
Disclaimer
This article is for informational purposes only and does not constitute financial, investment, tax, or legal advice. Market data, tax rules, and prices can change after the article date. TECHi and its authors may hold positions in securities or digital assets mentioned. Always conduct your own research and consult a licensed financial, tax, or legal professional before making decisions.
About the Author

Omer Sheikh covers Elon Musk-led and Musk-adjacent companies for TECHi, with a focus on Tesla, xAI, SpaceX, X, Neuralink, The Boring Company, and the public-market read-throughs from their product cycles, capital needs, AI infrastructure plans, supply chains, and regulatory risk. He also follows MicroStrategy/Strategy and its Bitcoin treasury strategy, using his finance background to connect balance-sheet decisions, capital markets, valuation, catalysts, and downside risk. His work is built for readers who want the investment case behind the headline: what changed, what it means for cash flow or market value, and what would prove the thesis wrong.