- Solar Is Cheapest PowerGlobal utility-scale solar hit $0.043/kWh in 2024 per IRENA, making it 41% cheaper than the cheapest fossil fuel alternative and the default choice for 66% of new US utility-scale capacity additions.
- Storage Changes EverythingGlobal battery storage deployments reached 247 GWh in 2025 (+23% YoY) per BloombergNEF. The 2026 forecast calls for 360 GWh, with utility-scale projects driving 84% of the gigawatt-hour adds.
- NextEra Owns the PipelineNEE finished 2025 with a 30 GW renewable and storage backlog after adding 13.5 GW in the year, its fourth consecutive record origination year. 2025 adjusted EPS of $3.71 (+8.2% YoY).
- Tesla Energy Outpaces CarsTesla deployed 46.7 GWh of storage in 2025 (+49% YoY) at 29.8% gross margins, producing $12.77B in revenue. Energy division margins now exceed automotive margins.
- First Solar Is the US MoatFSLR is the only US-headquartered company in the global top tier of solar manufacturers, qualifying for full IRA domestic content bonuses. 14 GW US capacity in 2026, 17.7 GW by 2027.
Solar is now 41% cheaper than the cheapest fossil fuel alternative. That is not an advocacy claim or a modeled forecast. It is what the utility bills look like in 2025 when the contracts come in. The International Renewable Energy Agency, in its Renewable Power Generation Costs in 2024 report, pegged the global weighted average cost of utility-scale solar at $0.043 per kilowatt-hour. Onshore wind came in at $0.034. The cheapest new combined-cycle gas plant still cannot touch either of those numbers on a levelized basis.
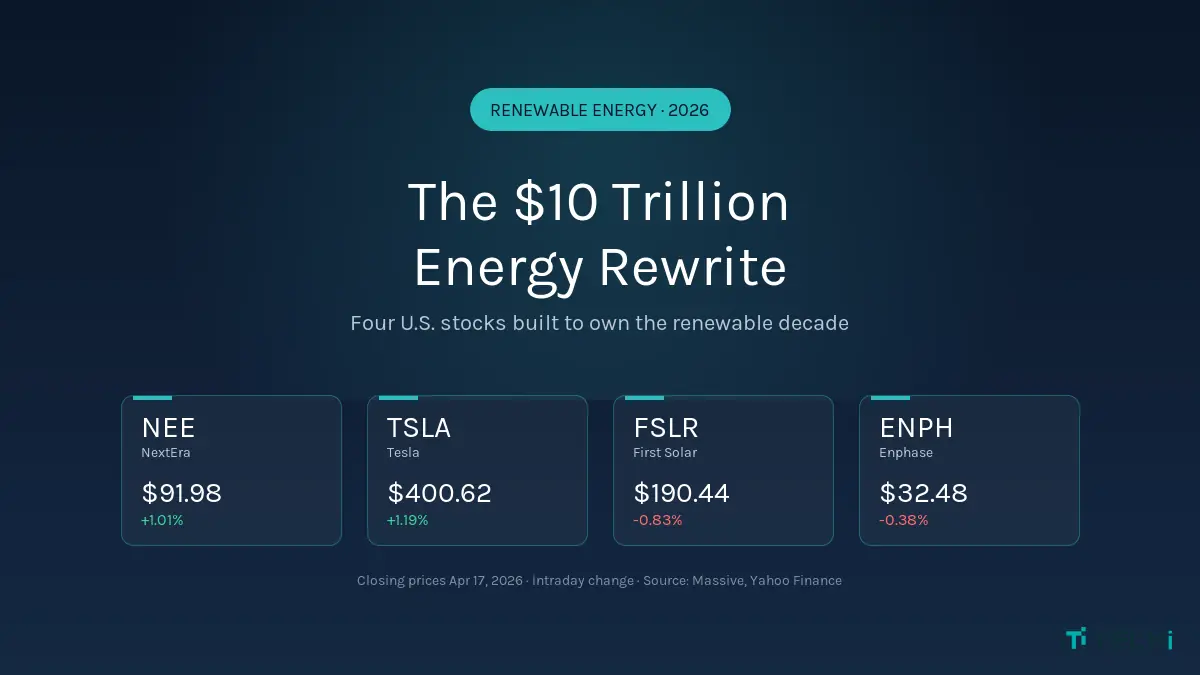
The cost curve is not the story anymore. The story is that the entire U.S. electrical grid has to be rebuilt around what this pricing makes possible, and only a short list of American companies are positioned to take the real money off the table. This is not about rooftop panels or ESG talking points. This is about who owns the generation assets, who builds the batteries that turn intermittent sun into firm capacity, and who controls the grid intelligence layer that stitches it all together. That shortlist runs through four tickers: NEE, TSLA, FSLR, and ENPH. Prices fetched live from Nasdaq market data on the April 17, 2026 close. All four are quoted through this article at verified session values.
The Four Stocks at a Glance
Ticker | Close (Apr 17, 2026) | Intraday | Role in the Thesis | Key Metric |
|---|---|---|---|---|
NEE | $91.98 | +1.01% | Utility-scale development anchor | 30 GW backlog · 2.71% yield · 32-yr dividend streak |
TSLA | $400.62 | +1.19% | Grid-scale battery storage | 46.7 GWh deployed · 29.8% energy gross margin |
FSLR | $190.44 | -0.83% | Domestic solar manufacturing moat | 14 GW US capacity 2026 · 17.7 GW by 2027 |
ENPH | $32.48 | -0.38% | Residential recovery trade | 46.1% non-GAAP margin · post-25D air pocket |
The Cost Revolution Wall Street Keeps Underpricing
Utility-scale solar installation costs have fallen 87% since 2010. Total installed cost per kilowatt of new solar capacity reached $691/kW in 2024 according to IRENA, down from roughly $5,100/kW fifteen years earlier. That one number explains every strategic move a U.S. utility has made in the past three years. When the marginal cost of new generation drops by nearly nine-tenths, the asset base of the incumbent power system stops being a moat and starts being a stranded-asset problem.
The International Energy Agency's Renewables 2024 report projects 5,500 GW of new renewable capacity additions between 2024 and 2030, nearly double the previous six-year run. That is not a scenario exercise. That is the current project pipeline already under contract. In the United States specifically, solar accounted for 61% of all new utility-scale capacity added to the grid in 2024 per U.S. Energy Information Administration tracking data, and 81% when paired battery storage is included. Natural gas, which dominated additions for fifteen straight years, fell to second place.
The $467 Billion Number Nobody Wants to Repeat
IRENA's 2024 accounting found that renewable capacity commissioned last year avoided an estimated
$467 billion
in fossil fuel costs globally. That is not a subsidy or tax credit. That is hard procurement savings booked against what utilities would have paid for gas and coal generation at the same output. 91% of all new utility-scale renewable projects delivered power at a lower cost than the cheapest new fossil alternative. The economic case is closed. The question now is execution.
Battery Storage Is the Sleeper Story of 2026
Here is the number that changed the thesis: global energy storage deployments are tracking 92 GW / 247 GWh in 2025, up 23% year-on-year, according to BloombergNEF's Energy Storage Outlook. BNEF's 2026 forecast calls for 123 GW / 360 GWh, another 33% annual expansion. Utility-scale projects will absorb 84% of those GWh additions. Lithium iron phosphate (LFP) chemistry dominates the chemistry mix because it costs less per cycle and lasts longer than nickel-based alternatives.
Storage solves the one remaining argument against a solar-heavy grid: the duck curve. When every utility in Arizona, Texas, and California puts panels on every viable acre, midday generation overwhelms demand and evening demand outruns supply. Four-hour batteries fix that problem for roughly 80% of the operating day. Eight-hour storage, now moving from pilot to commercial scale, covers most of the remainder. This is no longer a physics argument. It is a deployment argument.
And deployment takes capital, capacity, and relationships with grid operators that take a decade to build. Four U.S. companies have them.
NextEra Energy (NEE): The 30 GW Backlog the Competition Cannot Touch
NEE · NextEra Energy · NYSE
$91.98
+$0.92 (+1.01%) intraday
Session High
$91.42
NextEra Energy is not merely a renewables play. It is the renewables play in U.S. equities. The company finished 2025 with a 30 GW renewable and storage backlog, after adding 13.5 GW of new origination in the year alone. That is the fourth consecutive record year. For context: 30 GW is roughly equivalent to adding the entire installed electrical capacity of Washington state, in renewable form, on a timetable NextEra has already contracted. The company's Q4 2025 release, posted to NextEra's investor relations site, disclosed 7.2 GW brought online in 2025 and over 2 GW of battery storage placed in service, a 220% year-on-year increase in storage deployments alone.
The financials back the narrative. Full-year 2025 adjusted earnings landed at $7.68 billion, or $3.71 per share, for 8.2% year-on-year EPS growth. The dividend, now extended 32 consecutive years after the 10% hike in February 2026 to $0.6232 per quarter, yields roughly 2.71% at the $91.98 close. What separates NextEra from conventional regulated utilities is the hybrid structure: Florida Power & Light provides the rate-base cash engine, while NextEra Energy Resources (NEER) competes for merchant renewable contracts at scale nationwide. That split gives management a cost of capital most independent power producers cannot access.
The AI demand overlay makes the backlog look almost conservative. NextEra's deal to recommission the Duane Arnold nuclear plant under a long-term power purchase agreement with Google is the template for what is coming. Hyperscalers need firm, zero-carbon baseload at volumes utilities cannot supply from existing assets, and NextEra is the counterparty that can write that contract. This is the AI infrastructure power bottleneck Larry Fink has been flagging in plain operating terms.
Tesla Energy: The Most Profitable Division Inside Tesla
TSLA · Tesla, Inc. · Nasdaq
$400.62
+$4.70 (+1.19%) intraday
Session High
$401.52
The quiet repricing story in Tesla is not robotaxi. It is the energy business. Tesla deployed 46.7 GWh of storage in 2025, a 49% year-on-year jump, producing $12.77 billion in revenue at 29.8% gross margins. Those margins now outrun the automotive business. The division posted its numbers through Tesla's standard SEC filings, and the Q4 update confirmed Megapack production is capacity-constrained, not demand-constrained, for the sixth straight quarter.
Tesla's 2026 roadmap brings Megapack 3 and a 20 MWh Megablock into commercial deployment. The $20 billion capex guide CFO Vaibhav Taneja walked through on the Q4 call is aimed almost entirely at storage capacity expansion: Lathrop, Shanghai, and the new Houston facility coming online in the second half. If storage margins hold, this division alone would be a $40–50 billion revenue business by 2028 on current trajectory. That changes how you think about Tesla's enterprise value long before robotaxi economics settle.
The full investment picture, spanning automotive cyclicality, robotaxi optionality, the energy engine, and what Cathie Wood's $10 trillion market thesis implies, is laid out in our complete Tesla stock investment guide.
What 46.7 GWh Actually Means
46.7 GWh of battery storage is enough to power roughly 1.5 million U.S. homes for a day. Tesla deployed that volume in 2025 alone. For comparison, that single-year Tesla Energy deployment exceeds the total installed grid-scale battery capacity in the entire United States as of the end of 2022 (per EIA data). The scale change in three years is the kind of compounding that breaks linear financial models.
First Solar (FSLR): America's Only Vertically Integrated Solar Manufacturer
FSLR · First Solar · Nasdaq
$190.44
-$1.59 (-0.83%) intraday
Session High
$191.12
First Solar is the only U.S.-headquartered manufacturer in the global top tier of solar module production. Every other meaningful competitor (Longi, Trina, JA Solar, Jinko) is Chinese. That single fact has become a multi-billion-dollar trade war moat. First Solar's thin-film cadmium telluride (CdTe) modules do not touch the Uyghur polysilicon supply chain at any point in manufacture, and the company's entire fabrication footprint qualifies for the Inflation Reduction Act's 10% domestic content bonus credit. Utility-scale developers chasing those credits have been locked in at premium pricing through 2027.
The 2025 financials disclosed in First Solar's SEC 10-K filing showed $5.2 billion in net sales, $14.21 in diluted EPS, and a closing year-end capacity of 14 GW once the Louisiana facility ramps to full throughput. The South Carolina fab moves that to an estimated 17.7 GW by 2027. The 2026 guide calls for $4.9–5.2 billion in revenue and 17.0–18.2 GW in module shipments.
CdTe thin-film also has a technical edge utility developers have grown to love: its temperature coefficient is more forgiving than crystalline silicon, so the modules hold more of their rated efficiency in hot desert sites where most U.S. utility solar is actually built. First Solar hit a certified 23.1% efficiency record on CdTe in July 2024. The efficiency gap with silicon is closing, and the thermal-performance gap cuts the other way.
The bear case is real: the company cut its 2025 module shipment guide from 18–20 GW to 15.5–19.3 GW on tariff-related project delays, and the stock took the hit. But the long-duration backlog priced against IRA credits is what makes FSLR a five-year compounder, not a quarterly trade.
Enphase Energy (ENPH): The Residential Recovery Trade
ENPH · Enphase Energy · Nasdaq
$32.48
-$0.13 (-0.38%) intraday
Session High
$32.61
Enphase is the messier story on this list, and that is why it is here. The company reported Q4 2025 revenue of $343.3 million (down roughly 10% year-on-year) and guided Q1 2026 to $270–$300 million, a number that clearly spooked the market. The stock trades well below its 2022 peak. But inside the headline disappointment is a dataset that changes the shape of the trade.
Here is the context that matters: the One Big Beautiful Bill Act signed into law July 4, 2025 terminated the Section 25D residential solar investment tax credit effective December 31, 2025. For roughly fifteen years, homeowners had claimed a 30% federal credit against the cost of rooftop solar and battery installation. That credit is gone for any system placed in service in 2026 or later. The Q4 2025 numbers captured a demand pull-forward, and the Q1 2026 guide captures the air pocket behind it. U.S. sell-through, the measure of installed units reaching homeowners through Enphase's distribution network, jumped 21% quarter-on-quarter to a two-year high. That is the leading indicator. Channel inventory bled down as installers pulled forward volume ahead of the Section 25D deadline. The company shipped 1.55 million microinverters and 150 MWh of batteries in the quarter, and Q1 order flow for the new IQ9 3P commercial microinverter already crossed 50,000 units. Gross margins held at 46.1% non-GAAP, a number most industrial hardware companies would kill to post during a revenue downcycle.
Enphase is not the stable compounder NextEra is, and it is not the scale monster Tesla Energy is becoming. It is a tech-driven cyclical with a defensible distribution franchise in residential solar: the segment most exposed to interest rates and policy changes, and also the segment with the steepest operating leverage coming out of a trough. If the 2026 Fed cut cycle plays out and residential mortgage rates normalize, Enphase has the earnings power to re-rate fastest of the four names.
Risk Profiles: Which Stock Fits Which Portfolio
These four companies are not substitutes. They occupy different rungs of the risk ladder, and treating them as interchangeable is how portfolios get hurt.
Ticker | Role | Risk Profile | Best Fit For |
|---|---|---|---|
NEE | Regulated utility + renewable developer | Low-to-moderate · bond-like total return | Income-focused, long-duration compounders |
TSLA | Storage + EV + autonomy optionality | High · founder-driven, high-beta | Growth investors comfortable with volatility |
FSLR | Pure-play U.S. solar manufacturer | Moderate-to-high · policy-sensitive cyclical | Thematic investors with 3–5 year horizon |
ENPH | Residential inverter + storage hardware | High · rate-sensitive, tax-credit exposed | Tactical recovery trade, post-trough re-rating |
A reasonable portfolio allocation for an investor building exposure to the renewable transition would weight NextEra as the anchor, size Tesla and First Solar as the growth-conviction positions, and treat Enphase as a satellite position sized to the conviction behind the rate-cut and residential-recovery thesis. Sector concentration above 15% of a diversified equity portfolio starts introducing thematic risk that will hurt in any correction tied to energy policy or oil price reversals. The recent oil-price scenario analysis shows how quickly that dynamic can flip.
What Could Break the Thesis
Four Real Risks Worth Pricing In
1. IRA rollback.
Congressional repeal or materially weakening of Inflation Reduction Act credits would reprice every project economics model in the sector. First Solar and Enphase are most exposed; NextEra's long-dated contracts insulate it more.
2. Tariff escalation.
Polysilicon, wafer, and cell tariffs have already cut 2025 shipment guides. Further escalation against Southeast Asian imports would compress developer margins and delay projects.
3. Rate environment.
Renewable projects are capital-intensive and debt-financed. Every 100 bps higher on the long end changes project IRRs by roughly 200–300 bps. Enphase residential and NextEra's development pipeline both face this.
4. AI demand deceleration.
The hyperscaler electricity demand thesis is real but front-loaded. Any slowdown in data-center capex would remove a meaningful tailwind from NextEra's 2027–2030 backlog pricing power.
For investors weighing the renewable thesis against traditional energy exposure, the sensible comparison is our best oil & energy stocks investment guide, which covers the other side of the barbell. Nuclear sits in a third bucket entirely and is explored in the Oklo nuclear investment analysis.
The Bottom Line
The U.S. electrical grid is being rebuilt. Solar is the cheapest new generation source on earth. Storage is growing 33% annually and not slowing. Hyperscaler AI demand is pulling forward every project already in the pipeline and creating new RFP volume on top of that. Four U.S.-listed companies sit at the structural choke points of that rebuild: NextEra on the utility-scale development side, Tesla on batteries, First Solar on domestic modules, Enphase on residential hardware. None of them need a subsidy-driven story to work. The unit economics are already there.
What Wall Street keeps getting wrong is timing. The market repeatedly tries to trade this as a two-quarter narrative. IRA passes, stocks rip; tariff headline drops, stocks collapse; rate cut delayed, residential names get crushed. The underlying capacity buildout is happening on a fifteen-year timetable, and the cash flows show up for investors who can sit through the quarterly noise. The four names on this list will not move in lockstep. But they will compound.
FAQ
Frequently asked questions
Which is the best US renewable energy stock to buy in 2026?
There is no single best pick. The right answer depends on your risk tolerance. NextEra Energy (NEE) is the most conservative, anchored by a regulated utility, a 30 GW renewable backlog, and a 32-year dividend-increase streak. Tesla (TSLA) offers the highest growth from its storage business but carries EV-cycle volatility. First Solar (FSLR) is a pure U.S. solar manufacturer with IRA tariff protection. Enphase (ENPH) is the most cyclical recovery trade. A diversified allocation across all four is how most institutional investors approach the sector.
How cheap has solar power actually become?
Global utility-scale solar reached a weighted average levelized cost of $0.043 per kilowatt-hour in 2024 per IRENA, 41% cheaper than the cheapest new fossil fuel alternative. Total installed cost has fallen 87% since 2010, from roughly $5,100/kW to $691/kW. In the United States, solar LCOE sits at $0.070/kWh, slightly above the global average because of labor and permitting costs.
Is Tesla Energy bigger than Tesla's car business?
Not yet, but the gap is closing fast. Tesla's energy division generated $12.77 billion in 2025 revenue at 29.8% gross margins, which already exceed the automotive business. The division deployed 46.7 GWh of storage (+49% year-on-year). At current growth rates, Tesla Energy could reach $40–50 billion in annual revenue by 2028, a scale that would meaningfully change how Tesla's enterprise value is calculated.
Why is First Solar different from other solar manufacturers?
First Solar is the only U.S.-headquartered company in the global top tier of solar module manufacturing. Its cadmium telluride (CdTe) thin-film technology does not use Chinese polysilicon, so its entire output qualifies for the Inflation Reduction Act's 10% domestic content bonus credit. Utility developers chasing those credits have locked in First Solar's capacity at premium pricing through 2027. The company also holds a 23.1% certified efficiency record for CdTe cells.
What is the biggest risk to US renewable energy stocks?
The single biggest near-term risk is a material rollback or repeal of Inflation Reduction Act tax credits, which underpin the return profile of most utility-scale projects currently under contract. Other material risks: further escalation of Chinese polysilicon and cell tariffs, a sustained high-rate environment that lifts project discount rates, and any deceleration in hyperscaler data-center electricity demand, which has been a key demand driver for NextEra's 2027–2030 backlog.
How much battery storage was deployed globally in 2025?
BloombergNEF tracked 92 GW / 247 GWh of new energy storage deployments in 2025, a 23% year-on-year increase. Utility-scale projects accounted for 84% of the gigawatt-hour additions. Lithium iron phosphate (LFP) remained the dominant chemistry. The 2026 forecast calls for 123 GW / 360 GWh, a further 33% annual expansion.
Disclaimer
This article is for informational purposes only and does not constitute financial, investment, tax, or legal advice. Market data, tax rules, and prices can change after the article date. TECHi and its authors may hold positions in securities or digital assets mentioned. Always conduct your own research and consult a licensed financial, tax, or legal professional before making decisions.
About the Author

Ayesha Riaz covers the energy complex for TECHi — oil majors, refiners, LNG exporters, renewables, and the ESG disclosures that either support or undermine corporate climate commitments. She tracks EIA weekly inventories, OPEC+ production decisions, and regulatory actions out of FERC and the SEC's climate-disclosure regime. Her energy coverage takes both the transition timeline and near-term cash flow seriously, which most analysis does not.